
Four full-scale UHPC girders, predicted from their published data
HRC Designer reproduces four laboratory flexure tests of prestressed UHPC girders with spans from 7.09 m to 23.93 m. Each model uses the section and strands drawn in the source and the loading of the actual test, with the tension law taken from separate material tests wherever the source reports them, and each result below comes from a run of the Cross-Sectional Analysis module.
- −12.4%Peak load of a girder on a 23.93 m span predicted from four 51 mm prism tests, 692 against 790 kN. The forward model of the test report is 28.0% low.Graybeal 2006 · FHWA
- 2.0×Lower moment-curvature error than the nominal design curve published with the test, 295 against 591 kN·m.El-Helou and Graybeal 2022
- −1.5%First peak of a pretensioned I-girder on a 7.09 m span, 2052 kN calculated against 2083 kN measured, at 47.4 against 48.7 mm.Fang, Tian and Peng 2023
- 1.5%Deflection RMSE across the tested service range of a test girder with the cross section of the first UHPC bridge in the United States.Wipf et al. 2009 · Iowa
The four test girders to scale, with a 1.75 m person beside them. Drag to turn the group, select a label to jump to its test.
The same route for every girder
Each test is rebuilt from the published drawings and from material tests of the same concrete wherever the source reports them, and the calculated response is then laid over the measured one. Cases 1 and 2 take their tension law from material tests alone, and Cases 3 and 4 state exactly which quantity was set from the girder.
- Published geometrySection outline, strand rows, bars, span and load points from the dimensioned drawings of each source.
- Reported material testsTension law from prism or direct tension tests, identified with the inverse analysis of HRC Designer, plus the reported modulus and compressive strength. Where no tension test is published, the law is back-calculated from the girder and the case says so.
- Forward calculationMoment-curvature from the Cross-Sectional Analysis module with bonded prestressing, then load-deflection by curvature integration along the actual moment diagram.
Measured curves were digitized from the published figures, from their vector paths where the PDF holds them and from a 300 dpi raster for the Wapello report, and checked against the peak values the authors print. Each case states which quantities are forward predictions and which were set from the girder itself.
24.4 m AASHTO Type II girder, FHWA Girder 80F
FHWA Turner-Fairbank Highway Research Center · Graybeal (2006), FHWA-HRT-06-115
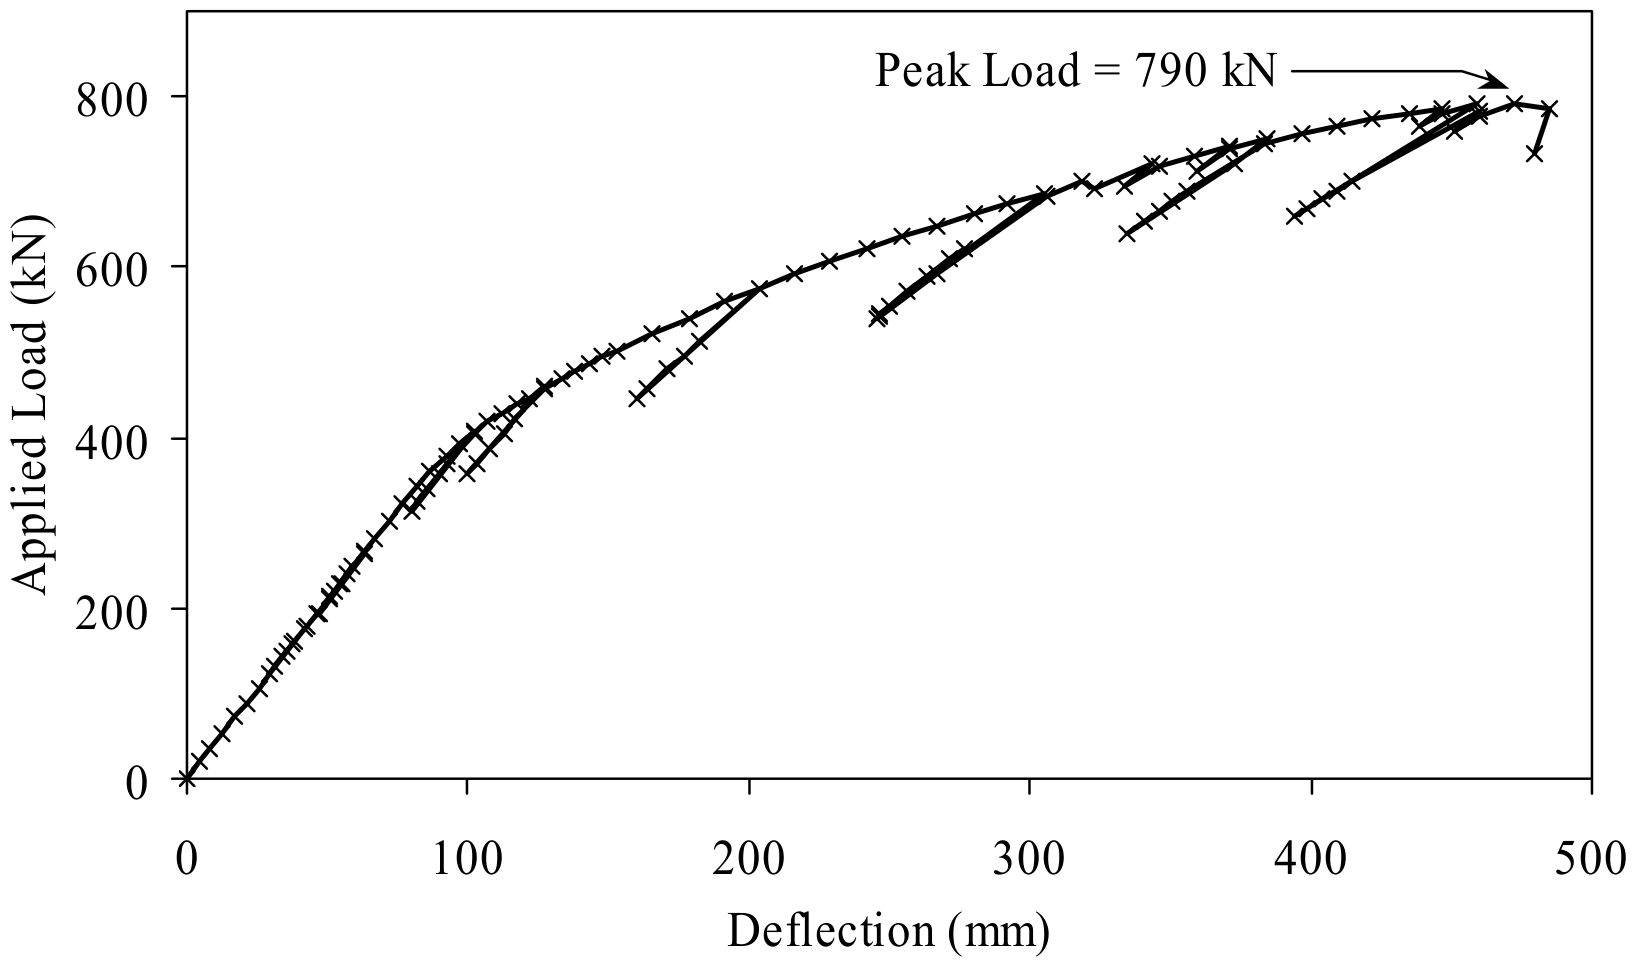
HRC Designer predicts a peak of 692 kN at a deflection of 447 mm for Girder 80F, 12.4% below the 790 kN at 470 mm reported by Graybeal (2006). The tension law comes from the inverse analysis of four steam-treated 51 mm prisms of the same UHPC product, so the girder curve is a forward prediction. The forward model of the report reaches 569 kN, 28.0% below the test, because it neglects the tension of the UHPC after cracking.
- Peak load
- 692 kNmeasured 790 kN, −12.4%
- Moment-curvature RMSE
- 416 kN·m9.5% of the measured peak moment
- Prism inverse fits, RMSE
- 1.2 to 2.2%of peak load, four prisms
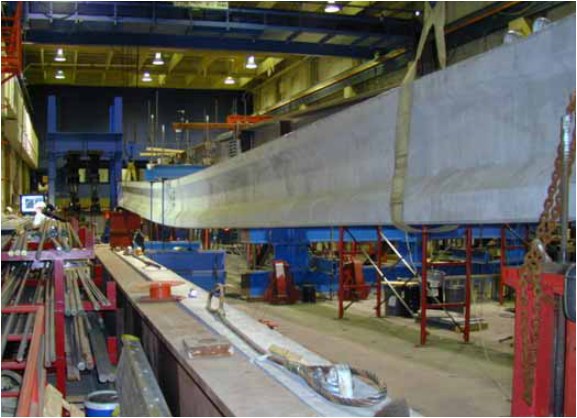
The 3D replay needs WebGL. The measured and calculated curves are shown beside it.
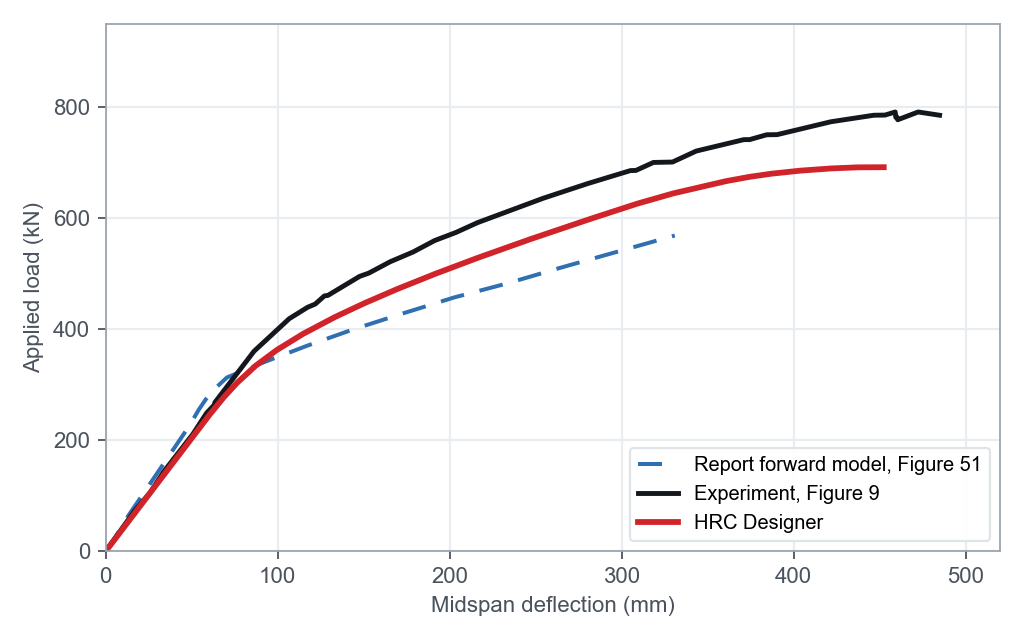
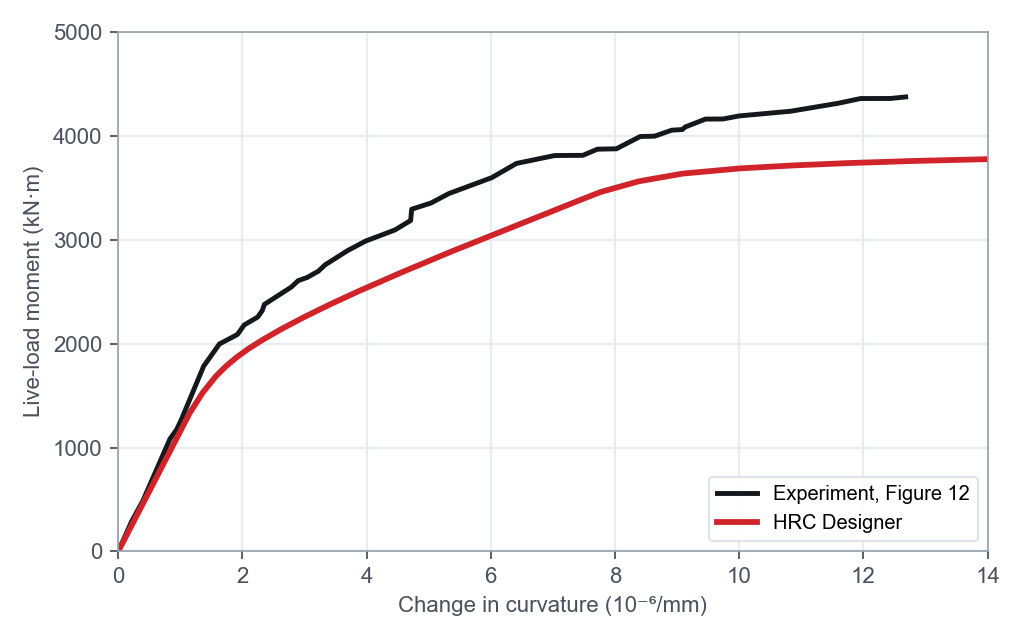
Measured curves are the loading envelope, with the unload and reload loops of the test left out.
ElasticDeflection 0 mmMeasured 0 kNHRC Designer 0 kN
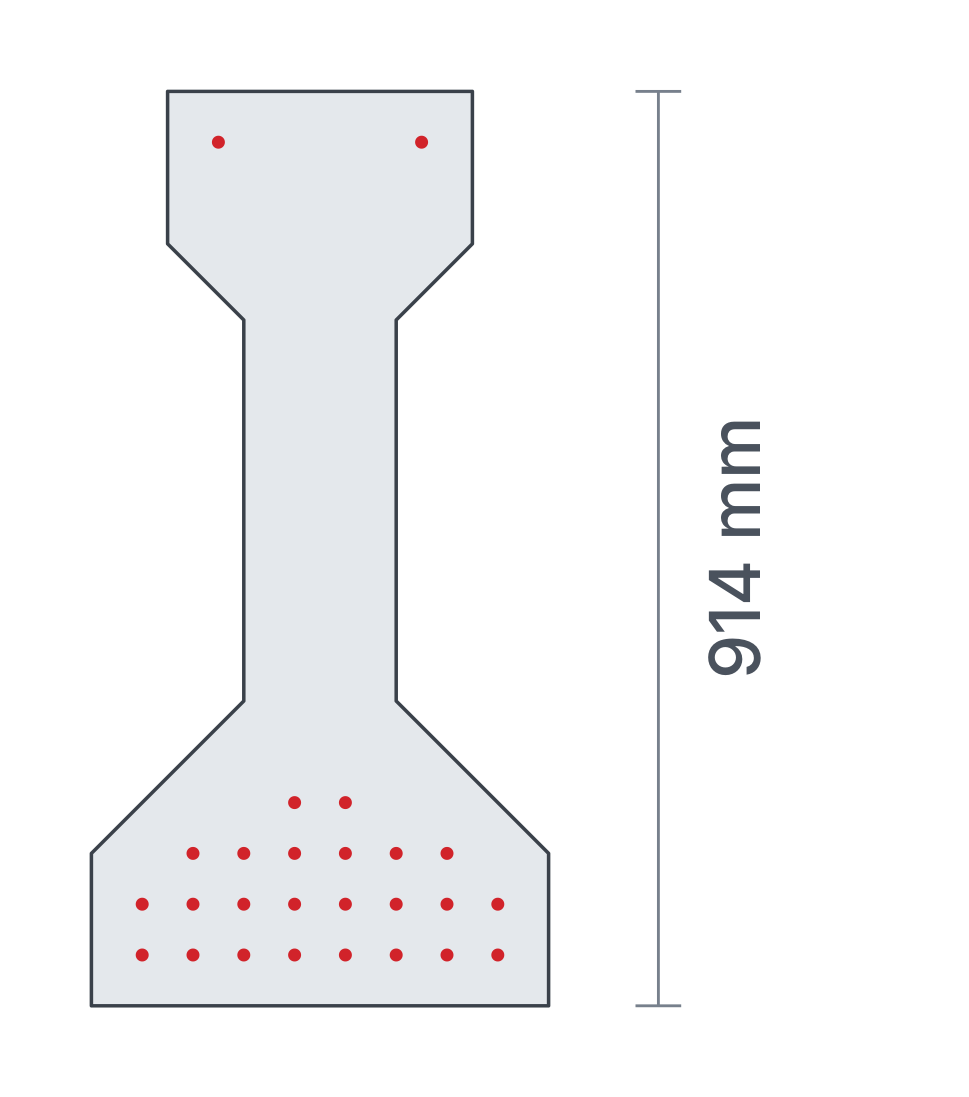
- Section AASHTO Type II, 914 mm deep, outline and strand grid from Figure 4
- Strands 26 of 12.7 mm in five rows, stressed to the strand strains reported at the start of the test
- Concrete E = 52.4 GPa and compressive strength 200 MPa from Table 4, tensile cracking strength 9.0 MPa from Table 2
How this case was modelled
Inputs from the source
Span 23.93 m between the roller supports, two loads 0.91 m either side of midspan, and self-weight of 5.79 kN/m from the reported density of 2480 kg/m³.
The effective prestress closes on the strand strains reported at the start of the test to within 1.33 MPa in every row.
Tension law
Each of the four prisms of FHWA-HRT-06-103 was fitted over its full curve with the strain-based inverse analysis of HRC Designer, with the tensile cracking strength of 9.0 MPa reported for steam-treated UHPC. The girder uses the median of the four laws with the modulus of 52.4 GPa measured on the girder concrete.
The only quantity set on the girder is the post-localization length, bounded between half and one section depth. It settled at the section depth of 914 mm, and it only changes the deflection after localization.
Reading the result
The calculated curve starts on the measured elastic stiffness and is 2.3% below the measured load at 50 mm of deflection. The model places the onset of cracking at 198 kN, where the report describes softening between 310 and 355 kN, and between 100 and 400 mm the calculated load runs 8.6 to 10.5% below the measured curve. The run ends by concrete crushing at 452 mm, after a peak of 692 kN at 447 mm, 12.4% below the test.
The forward model published in the report, Figure 51 with a cracking strength of 20 MPa, neglects the tension of the UHPC after cracking and reaches 569 kN, 28.0% below the test. It is shown for comparison and was never an input.
18.9 m pretensioned bulb-tee, FHWA 2022
FHWA Turner-Fairbank Highway Research Center · El-Helou and Graybeal (2022), J. Struct. Eng. 148(4)
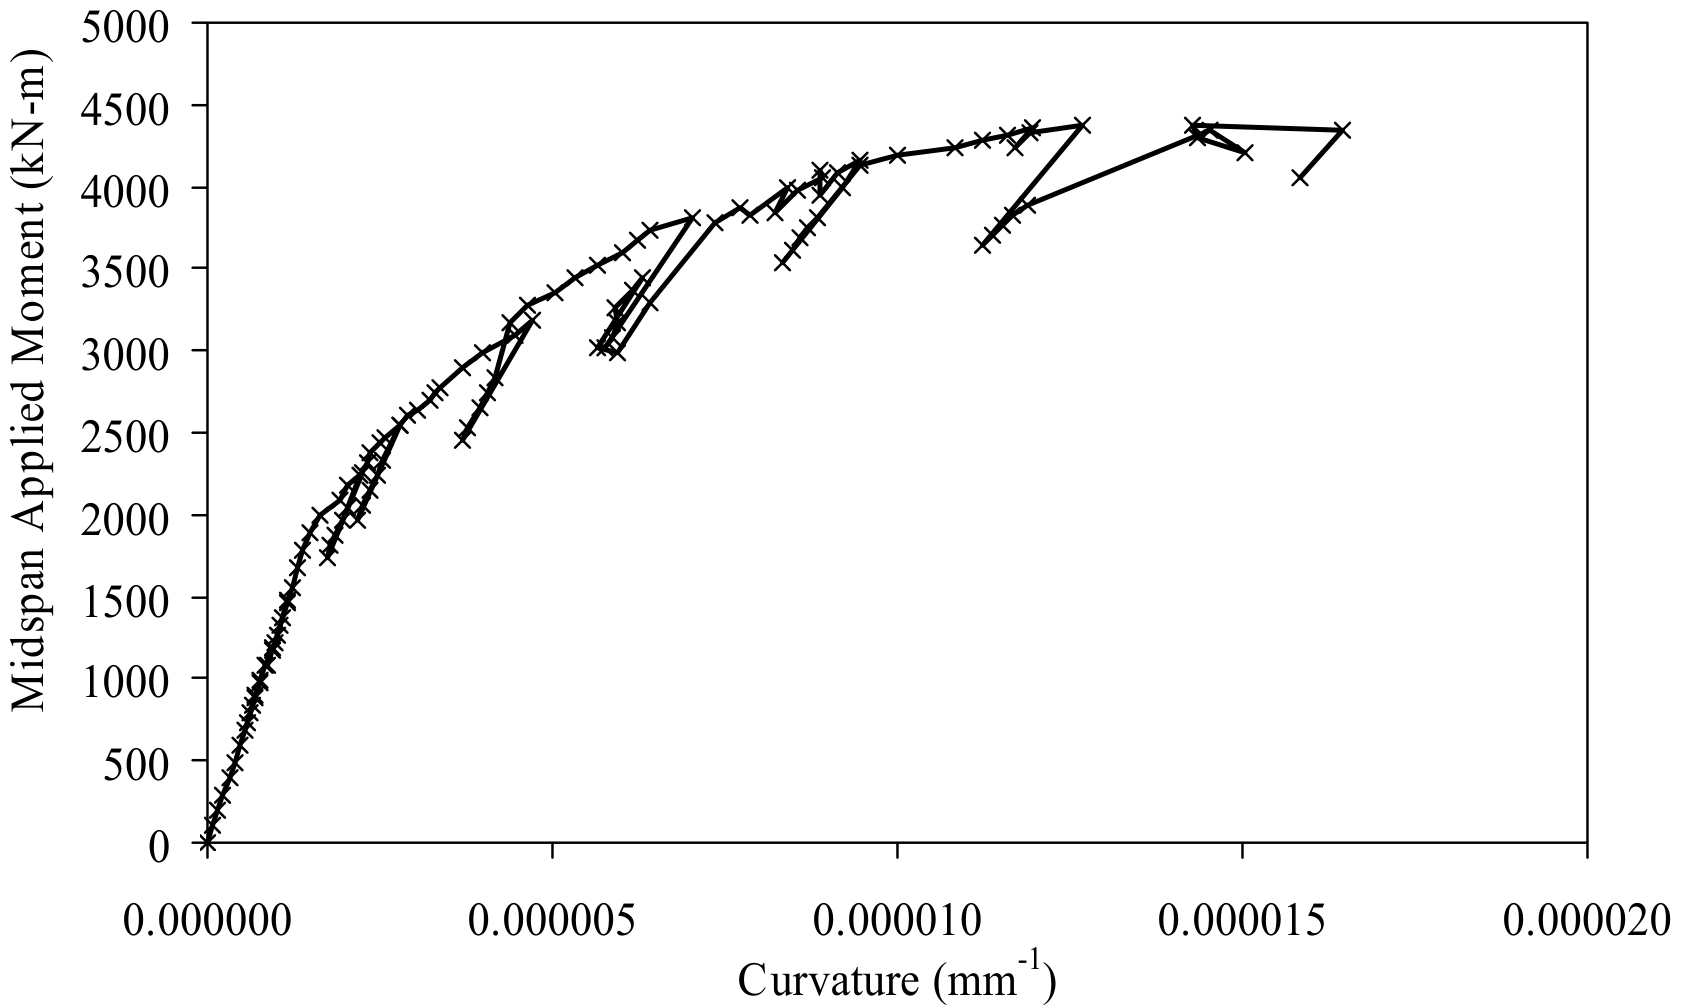
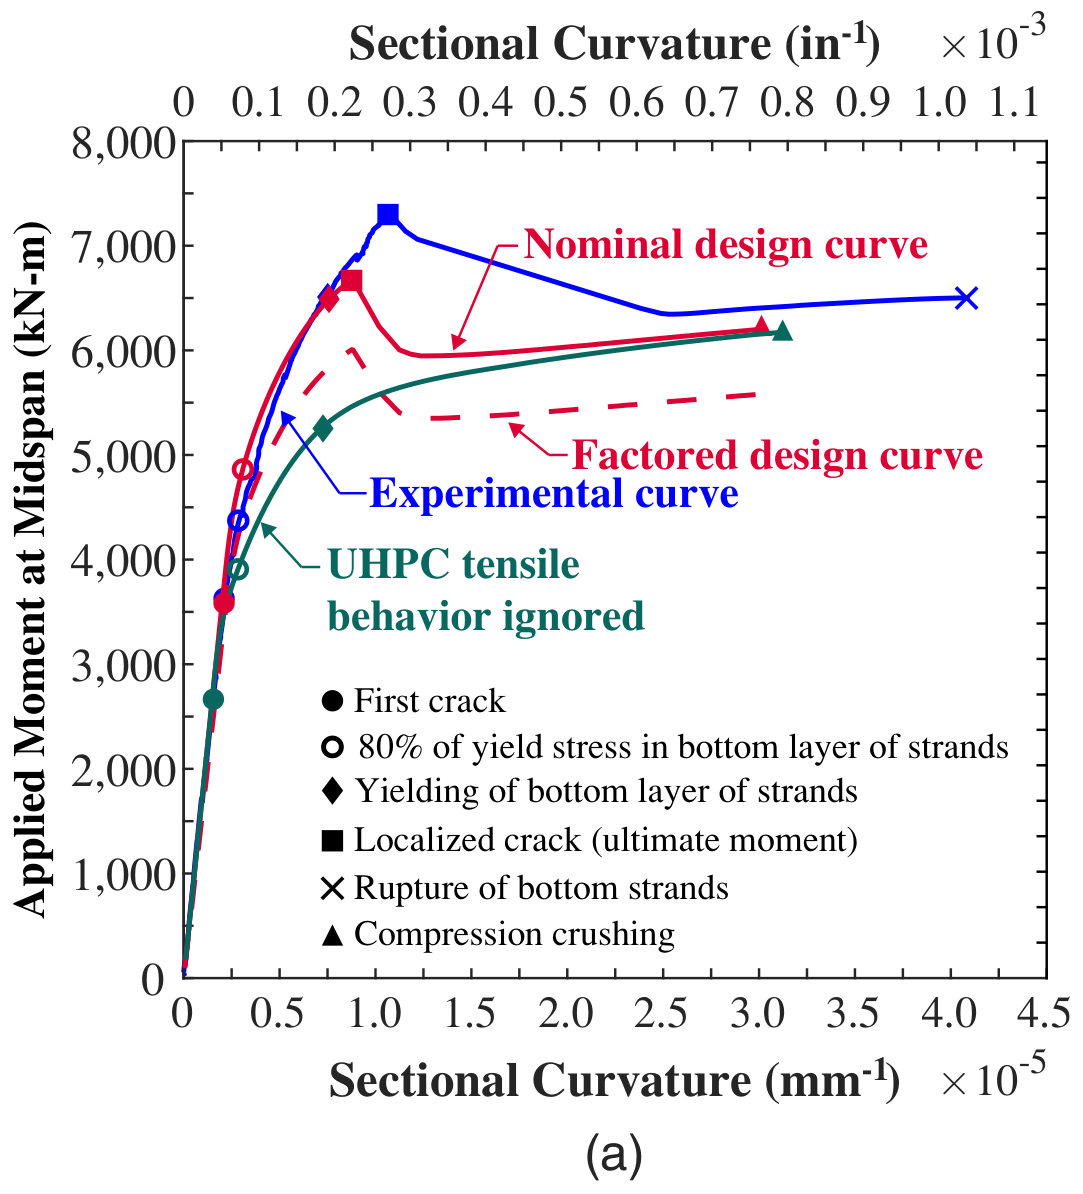
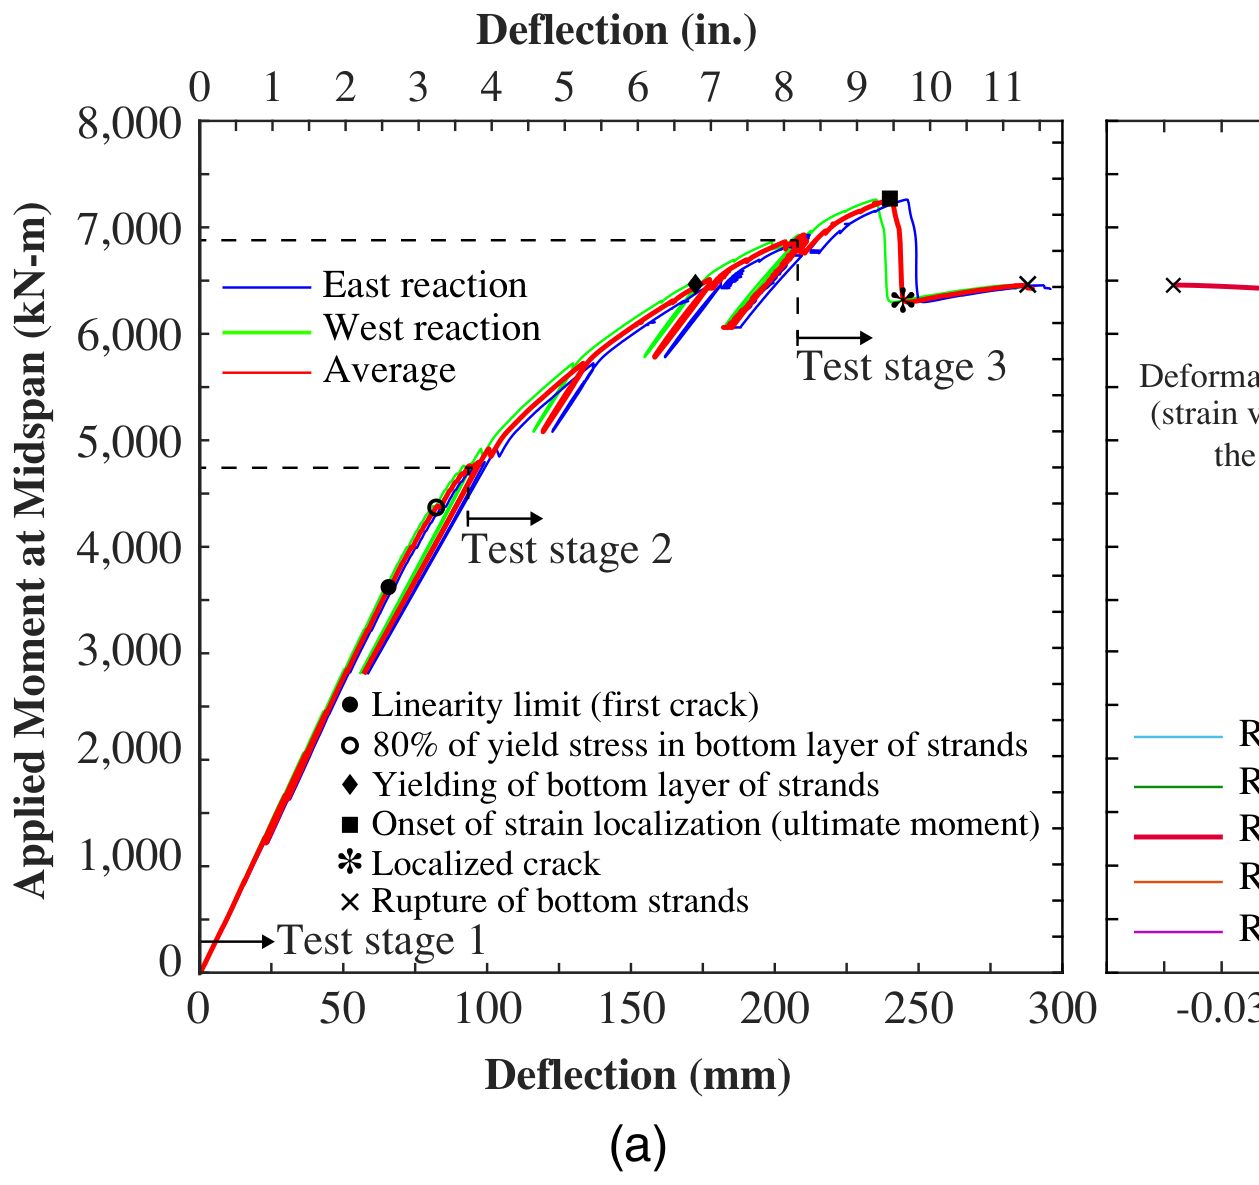
The moment-curvature of HRC Designer stays within an RMSE of 295 kN·m of the girder tested by El-Helou and Graybeal (2022), half the 591 kN·m error of the nominal design curve published with the test. The tension law is fitted to the full Batch A direct tension record with R² = 0.989, and the effective prestress closes on the three measured strand stresses to 0.003 MPa. The calculated localization moment of 6632 kN·m is 9.2% below the 7307 kN·m measured.
- Moment-curvature RMSE
- 295 kN·mpublished nominal curve 591 kN·m
- Localization moment
- 6632 kN·mmeasured 7307 kN·m, −9.2%
- Direct tension fit
- R² = 0.989RMSE 0.175 MPa, Batch A
The 3D replay needs WebGL. The measured and calculated curves are shown beside it.
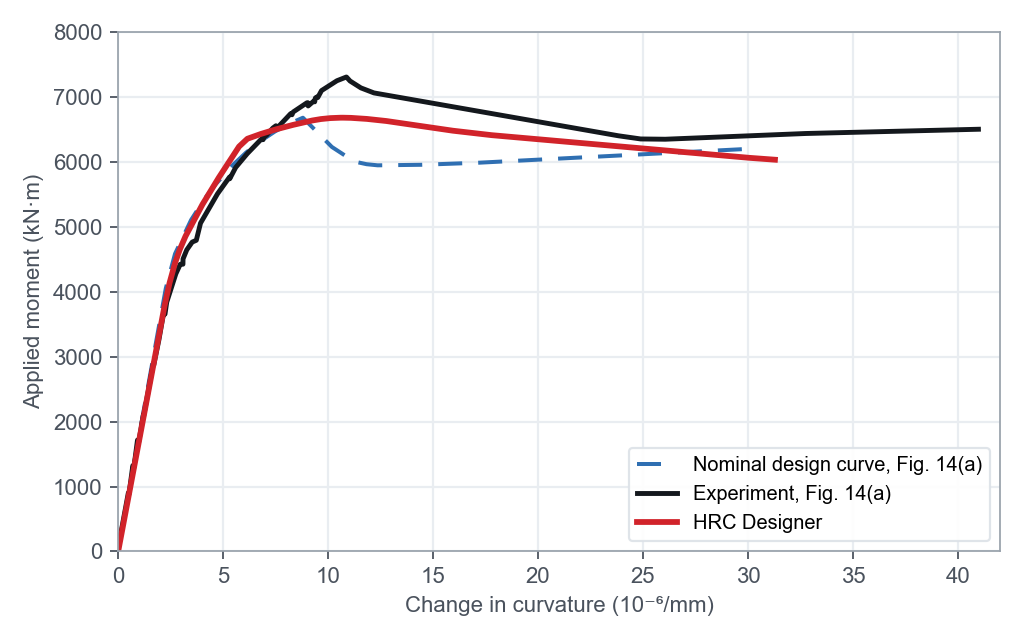
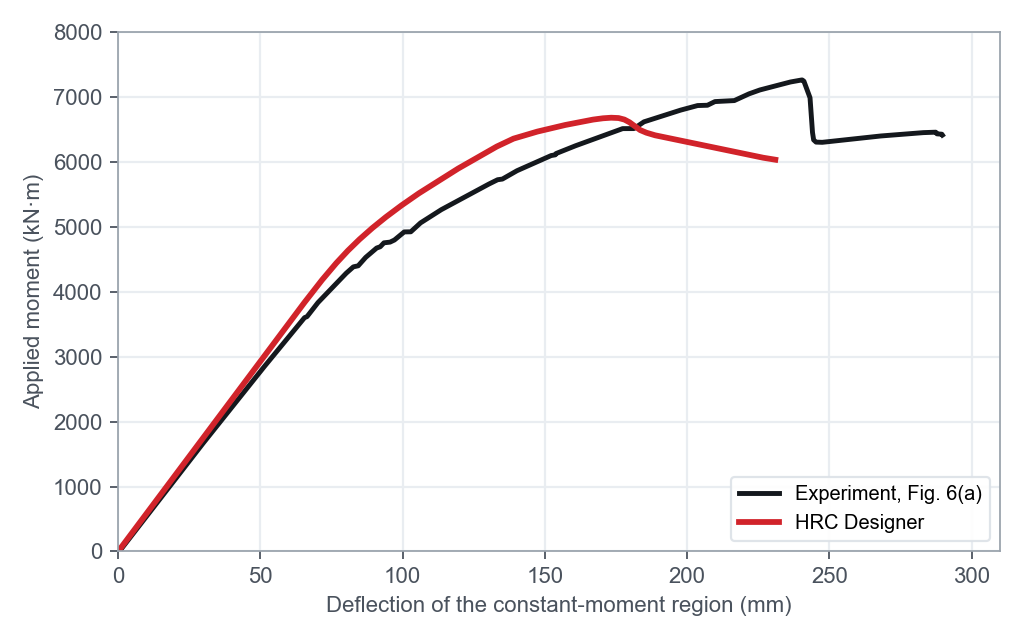
The applied moment excludes the initial 467 kN·m from self-weight and the loading apparatus, as in the paper.
ElasticDeflection 0 mmMeasured 0 kN·mHRC Designer 0 kN·m
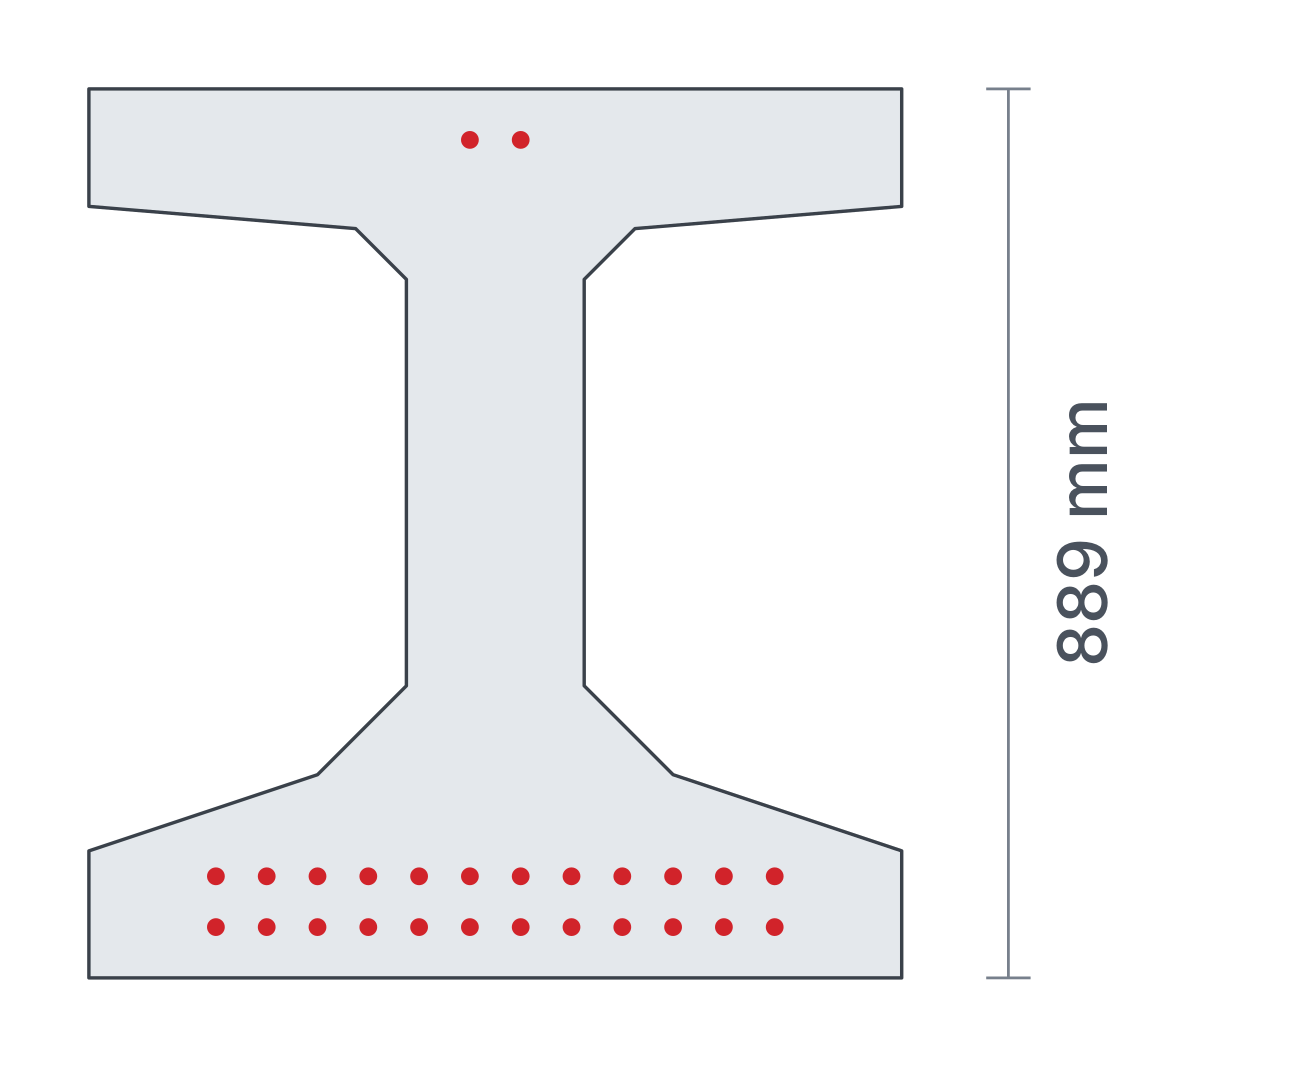
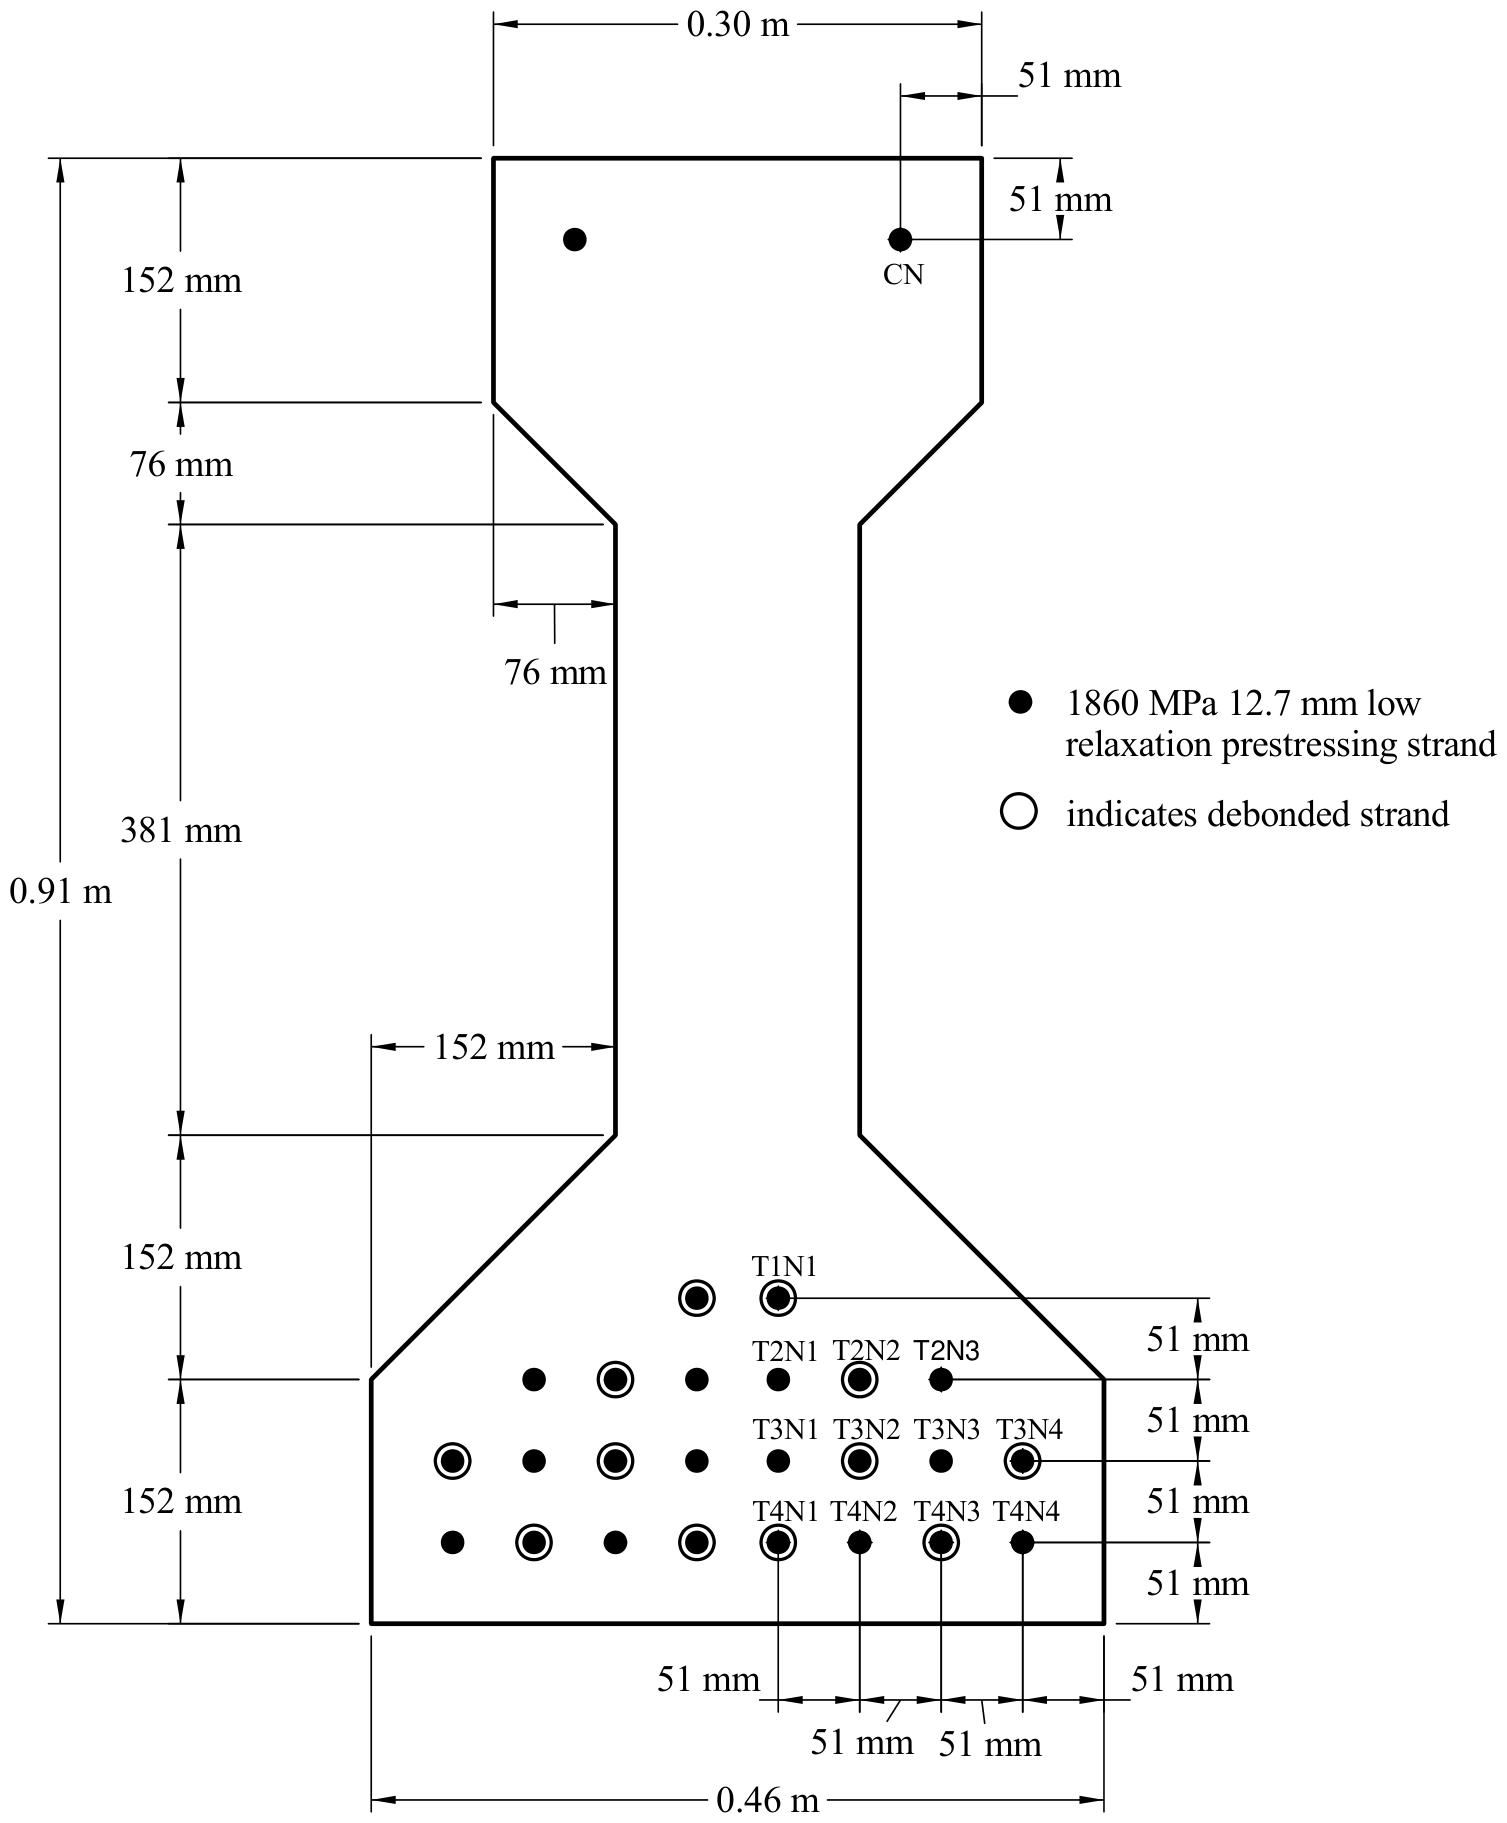
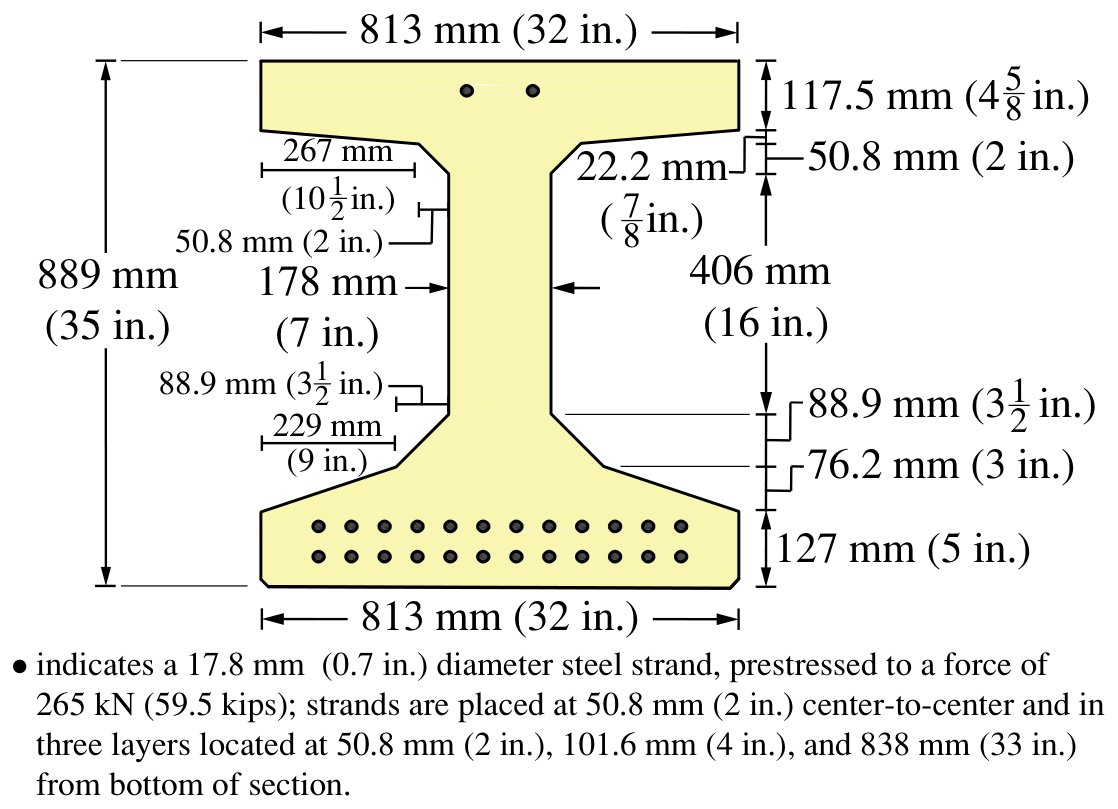
- Section 889 mm deep modified PCEF bulb-tee, exact dimensions of Fig. 2
- Strands 12 + 12 + 2 of 17.8 mm at 50.8, 101.6 and 838 mm, closed on 1144, 1157 and 1336 MPa
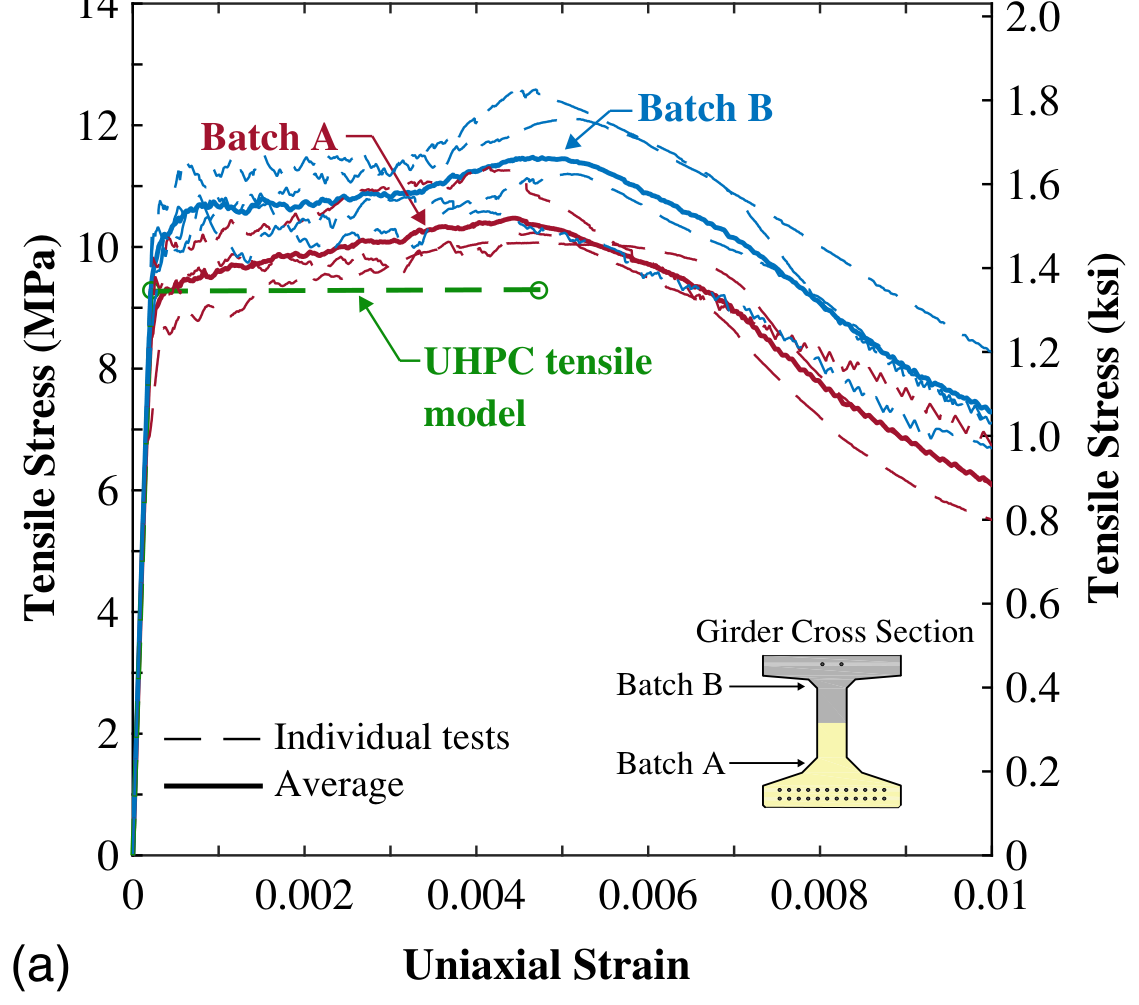
- Concrete Batch A in tension, Batch B in compression, 161 MPa
How this case was modelled
The test
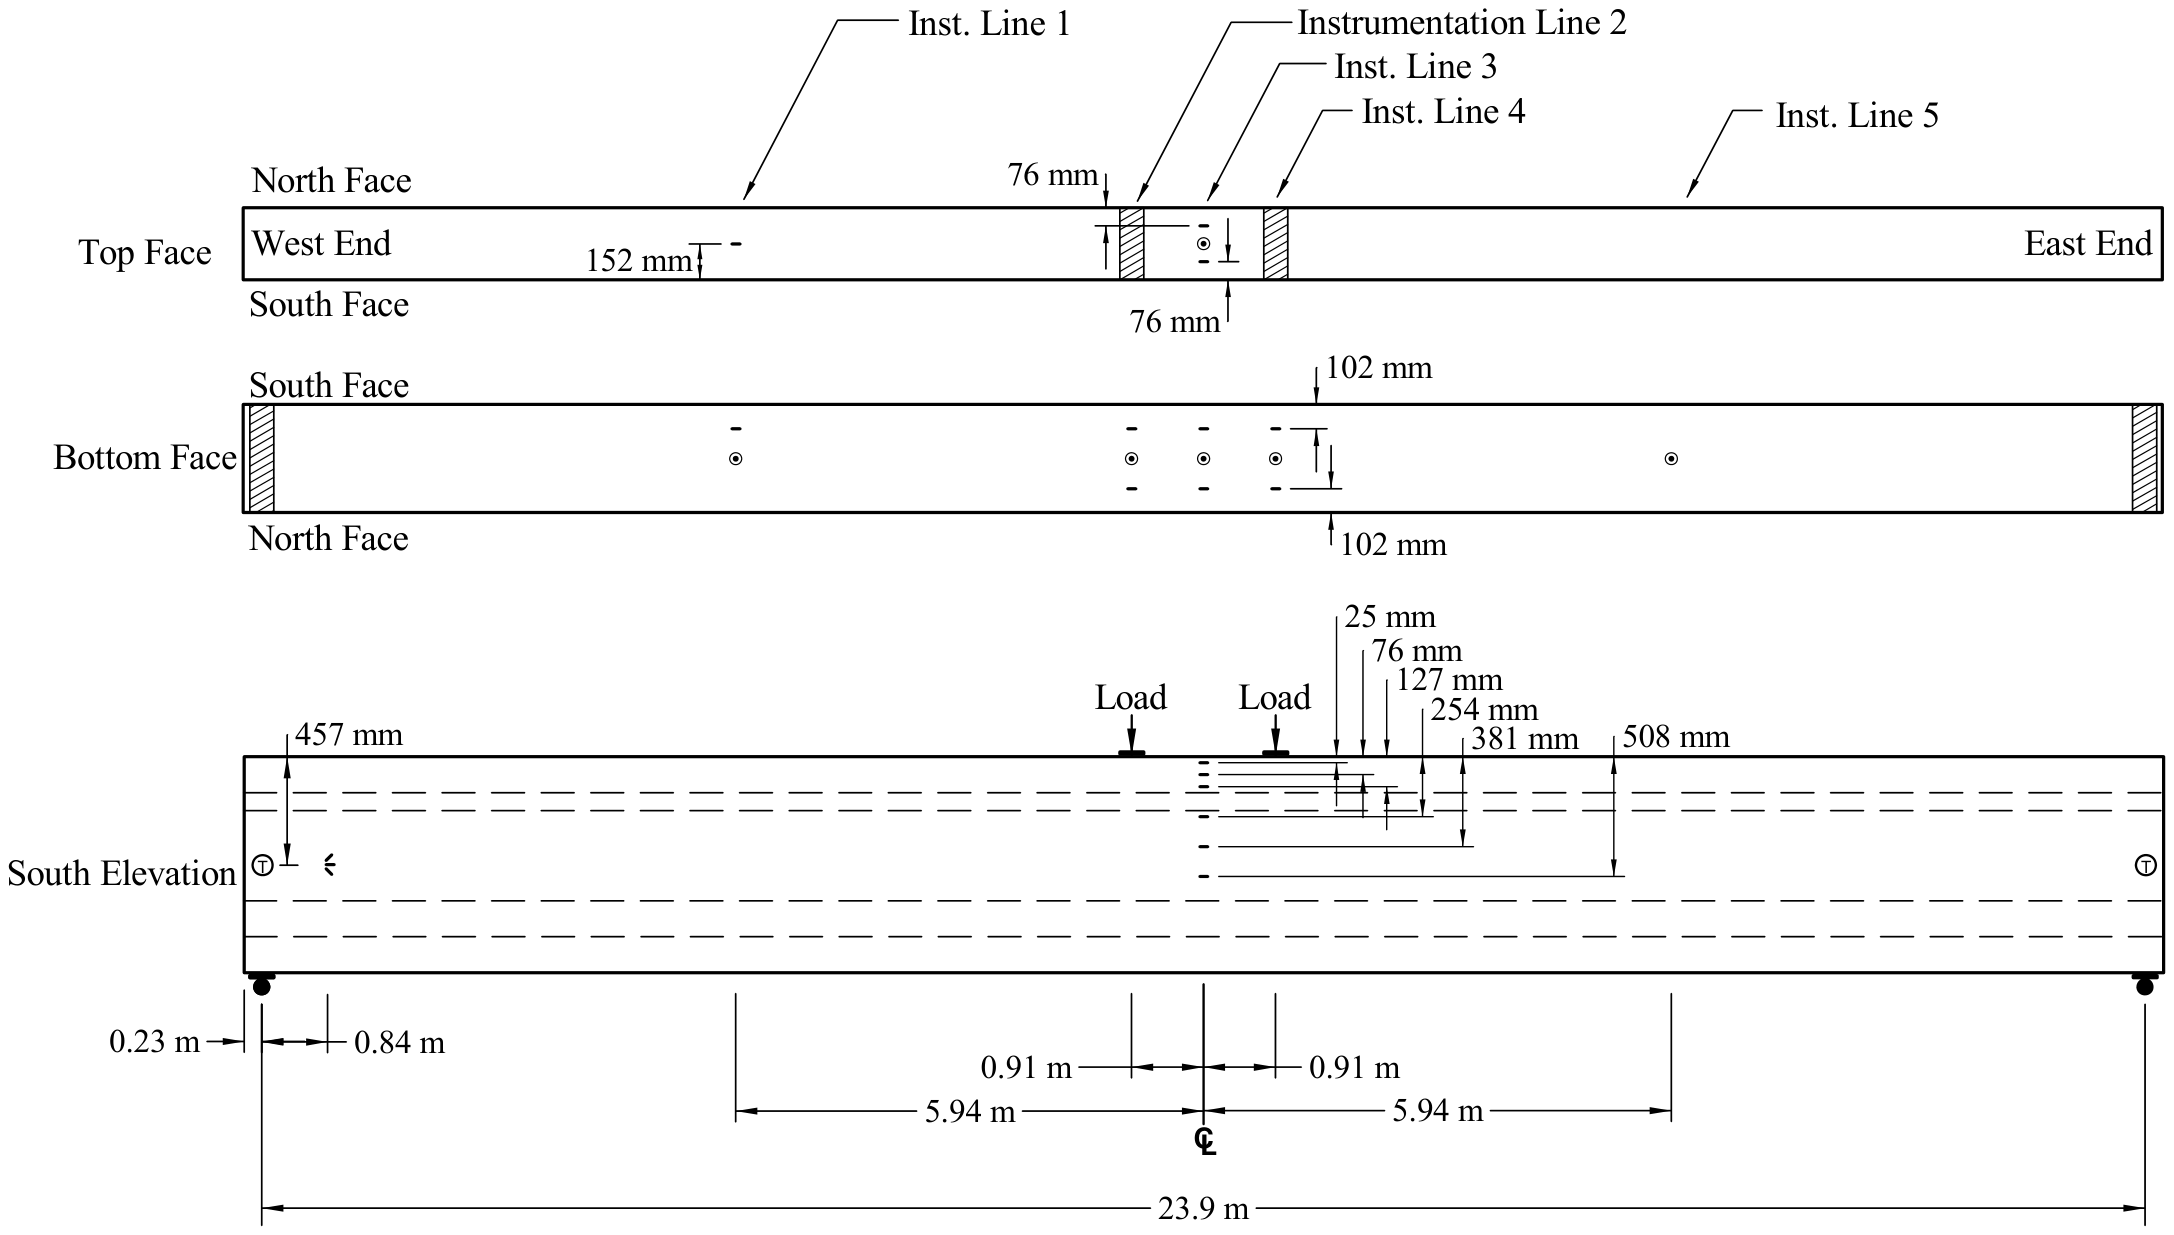
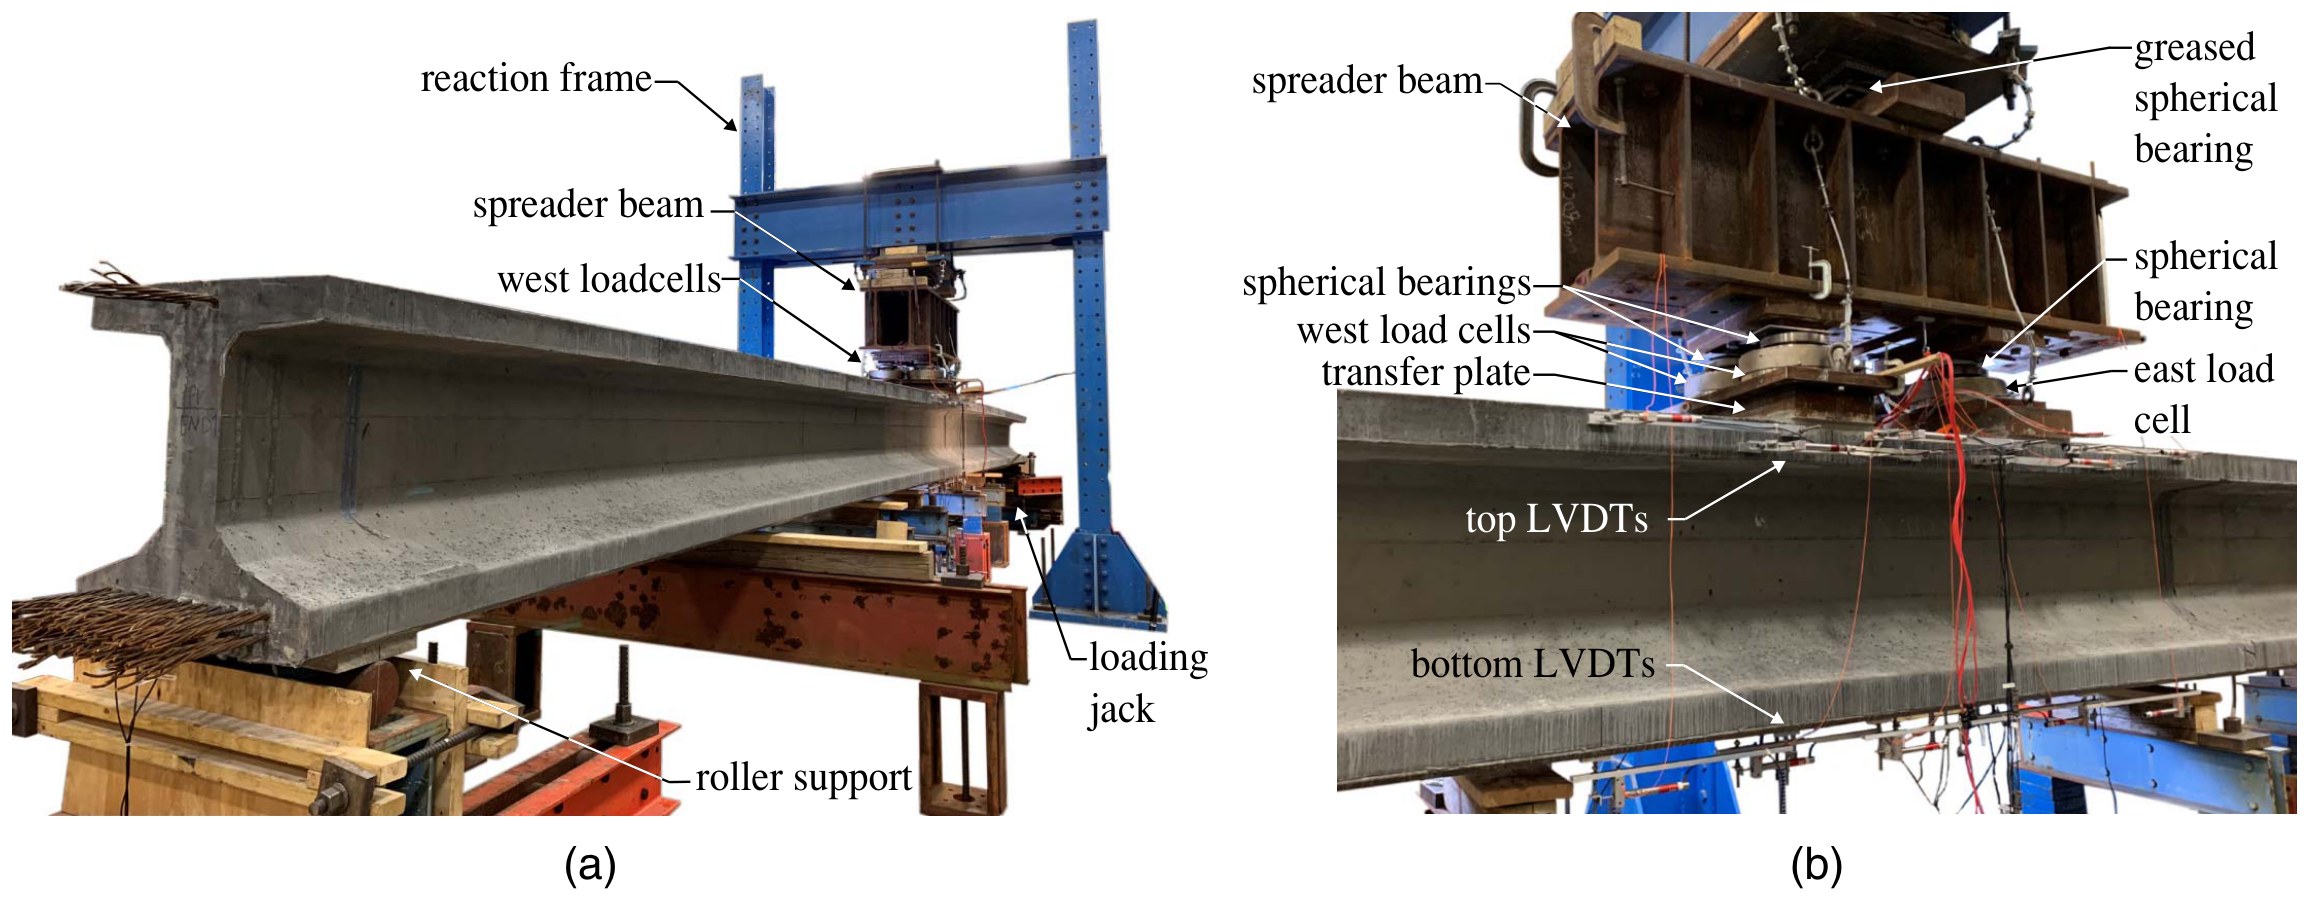
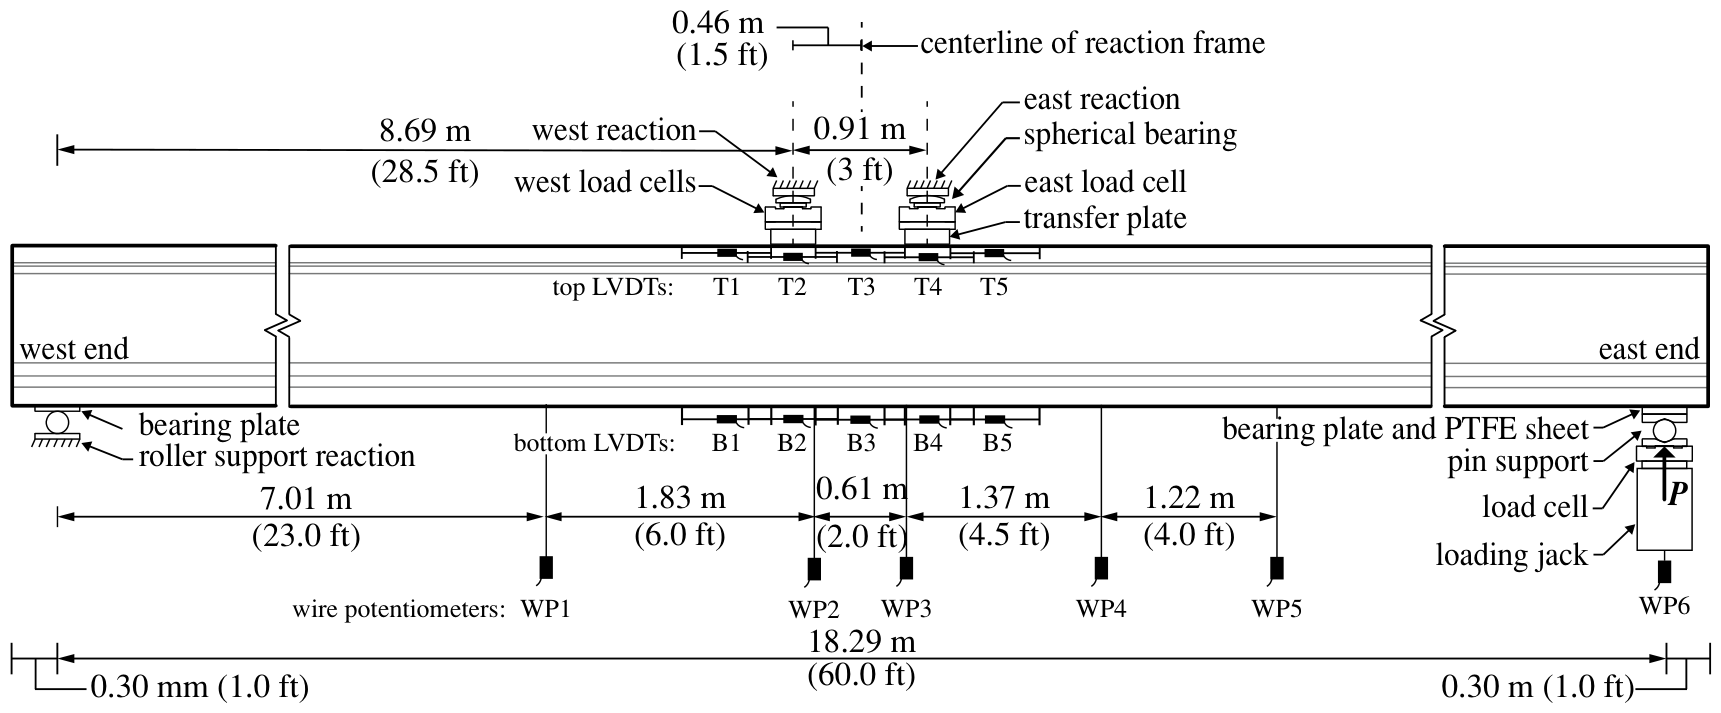
The 18.90 m girder spanned 18.29 m. A hydraulic jack under the east bearing pushed that end up against a hold-down frame that bears on the girder 0.46 m either side of midspan, which is the motion the 3D replay shows.
The authors estimated the effective prestress from four vibrating-wire gauges cast into the midspan section, 1144, 1157 and 1336 MPa by strand row, and the analysis starts from the 467 kN·m already acting when the test began.
The dimensioned Fig. 2 section was modelled as drawn. It has 2.4% less area and 5.3% less moment of inertia than the gross properties printed in the paper.
Tension law
The quadrilinear law keeps the Table 1 anchors of Batch A, 9.3 MPa at cracking and 10.4 MPa at the localization strain of 0.00497, and fits the descending branch of the average record. Nothing is fitted to the girder.
Reading the result
From 4000 to 6500 kN·m the calculated moment runs up to 385 kN·m, or 8%, above the measured one at the same curvature. The calculated localization moment is 9.2% below the measured 7307 kN·m, and the analysis of the authors falls 8% short at the same point.
After localization one crack governs the deflection. The smeared-curvature integration gives 164 mm at localization, while the paper reports 234 mm at capacity, so the moment path, not the post-localization deflection, is the validated quantity here.
7.45 m pretensioned UHPC I-girder, Hunan 2023
Hunan University Structural Engineering Lab · Fang, Tian and Peng (2023), Eng. Struct. 279
HRC Designer reaches a first peak of 2052 kN at 47.4 mm. Fang, Tian and Peng (2023) report 2083 kN at 48.7 mm for the tested girder, so the calculated peak is 1.5% lower in load and 2.7% lower in deflection. The paper publishes no tension test of this concrete, so the tension law was back-calculated from the measured moment-curvature of the girder and the load-deflection curve was then calculated forward along the actual moment diagram.
- First peak load
- 2052 kNmeasured 2083 kN, −1.5%
- Deflection at peak
- 47.4 mmmeasured 48.7 mm, −2.7%
- Moment-curvature RMSE
- 158 kN·m6.3% of the measured peak
The 3D replay needs WebGL. The measured and calculated curves are shown beside it.
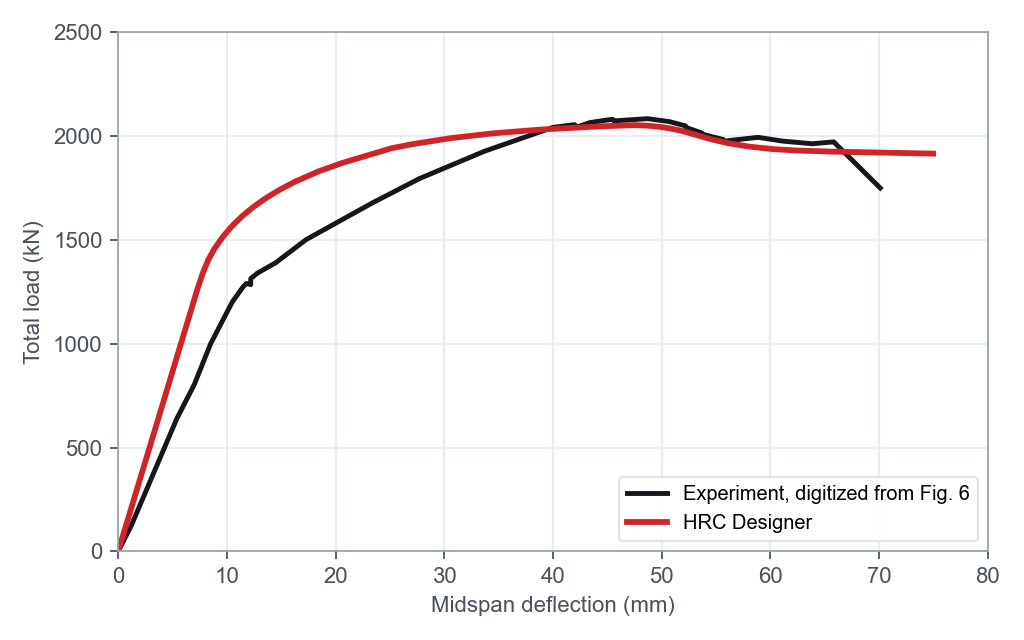
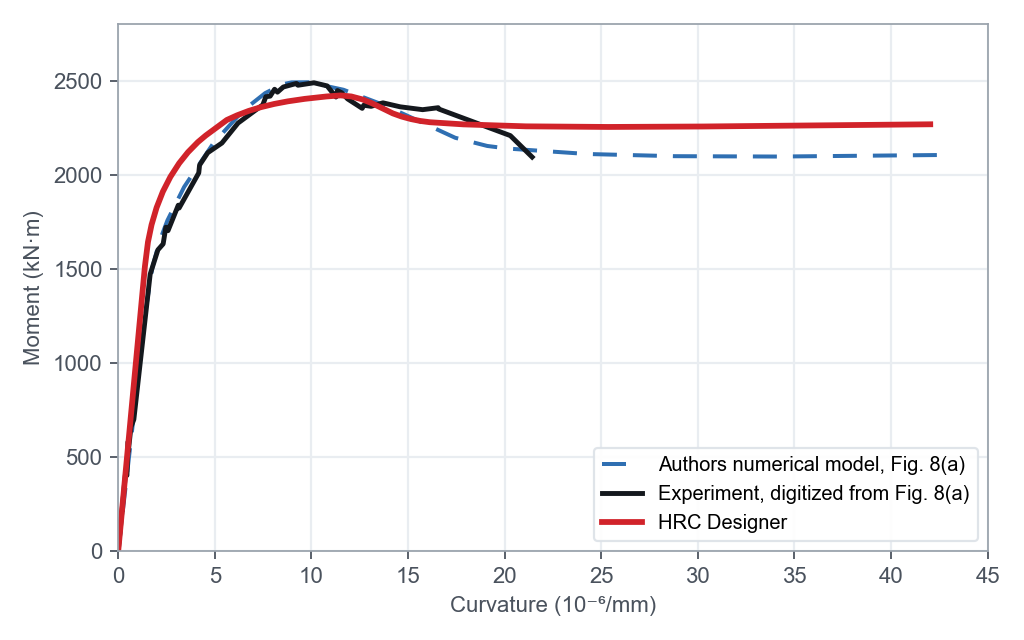
Measured curves digitized from the vector paths of Fig. 6 and Fig. 8(a) of the paper. The test ended with strand rupture near 70 mm.
ElasticDeflection 0 mmMeasured 0 kNHRC Designer 0 kN
How this case was modelled
Inputs from the source
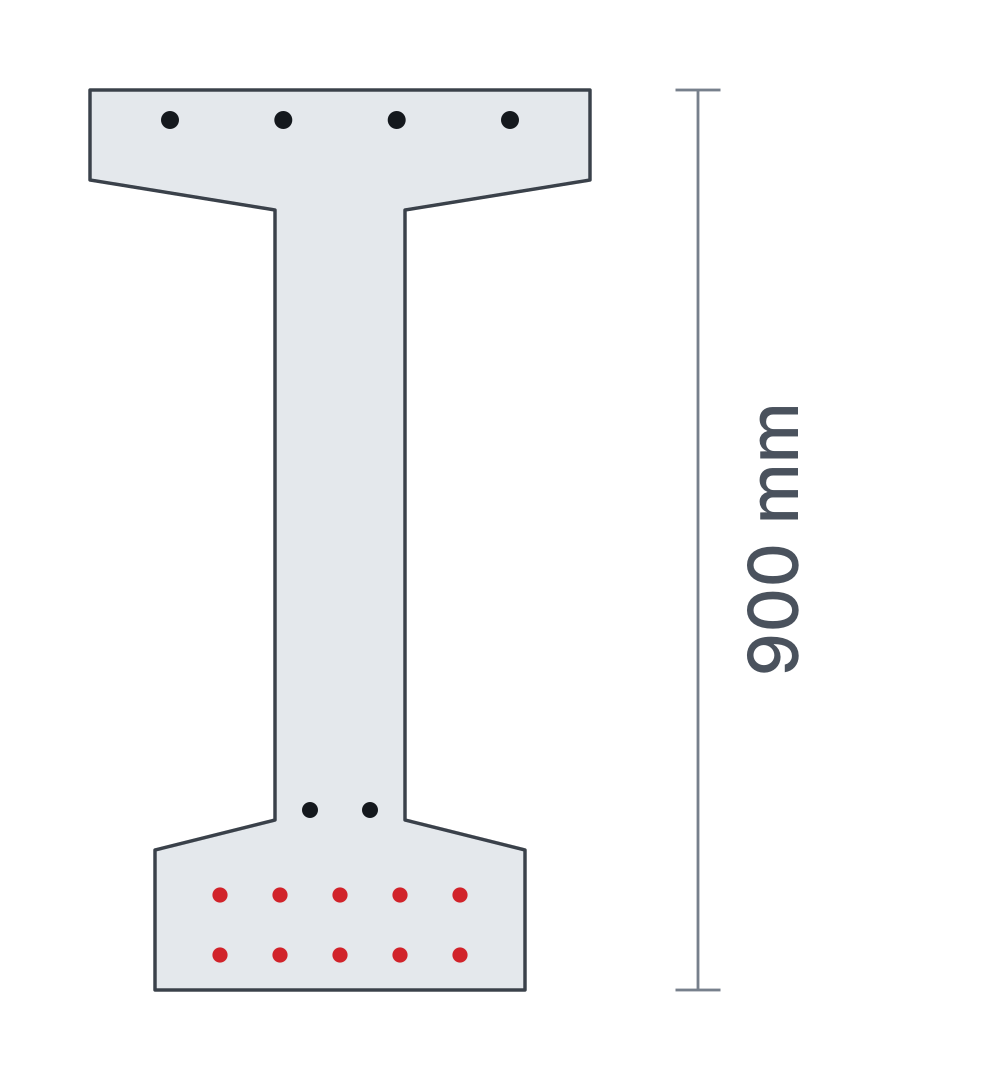
Span 7.09 m, two loads 2.36 m from the supports and a 2.37 m constant-moment zone, applied by a 3500 kN hydraulic testing machine through a spreader beam.
Ten 15.2 mm strands of 140 mm² pretensioned to 75% of the 1860 MPa ultimate strength, the reported bars, E = 53.8 GPa and a cube strength of 140.6 MPa.
Tension law
Back-calculated from the full measured moment-curvature of the girder, with 6.79 MPa at cracking, a residual plateau of 3.63 MPa and zero stress at a 23.06 mm crack opening. The paper lists a tensile strength of 9.2 MPa, which is kept as a reference only.
Reading the result
Because the law comes from the girder itself, the peak moment checks the consistency of the section model, while the deflection at peak is a forward result of the curvature integration.
Early in the test the measured girder is softer than the reported modulus implies for the exact section, 0.85 against 1.09 × 10¹⁵ N·mm², which is why the calculated curve rises faster below 1500 kN.
21.6 m test girder with the Wapello County bridge section
Iowa State University Structural Engineering Laboratory · Wipf et al. (2009), IHRB TR-529
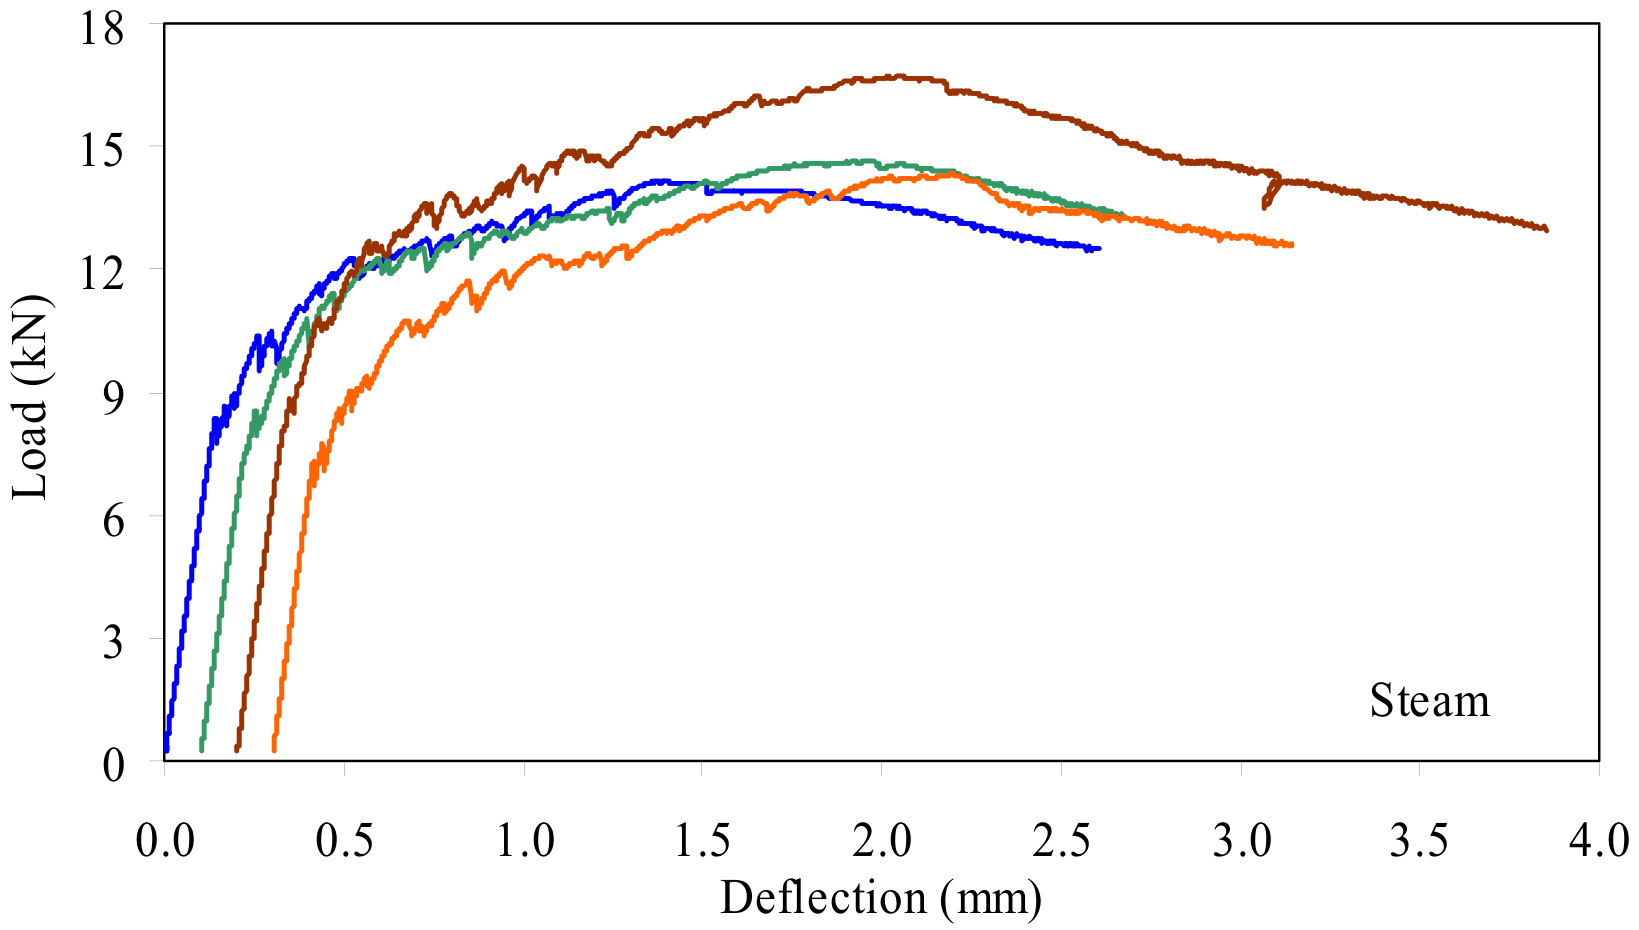
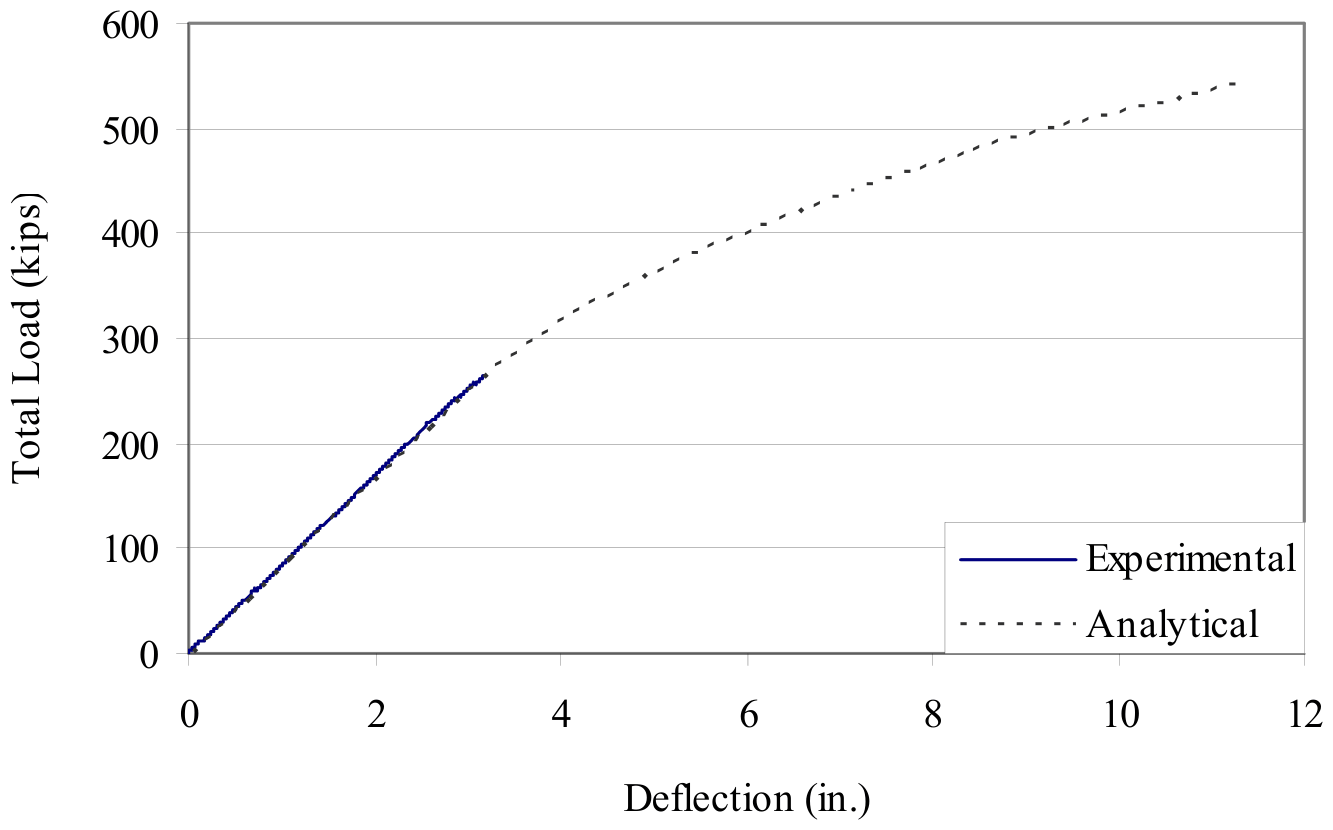
Across the whole tested range HRC Designer follows the load-deflection curve of the Wapello County test girder with a deflection RMSE of 0.049 in., 1.5% of the maximum deflection. Its elastic stiffness of 82.9 kip/in. is 2.2% below the 84.8 kip/in. read from the measured curve in Figure 6.4 of Wipf et al. (2009). Testing stopped at 265 kip and 3.2 in. to preserve the girder for shear tests, so this case covers service and first cracking only. Two quantities were set from the girder record, the effective prestress of 1310 kip, chosen so that the soffit cracks at the observed 237.4 kip, and the post-cracking hardening slope of the tension law, which rose to the upper limit of its search range.
- Deflection RMSE
- 0.049 in.1.5% of the 3.16 in. maximum
- Elastic stiffness
- 82.9 kip/in.measured curve 84.8, −2.2%
- Section
- 506.2 in.²47 strands of 0.6 in.
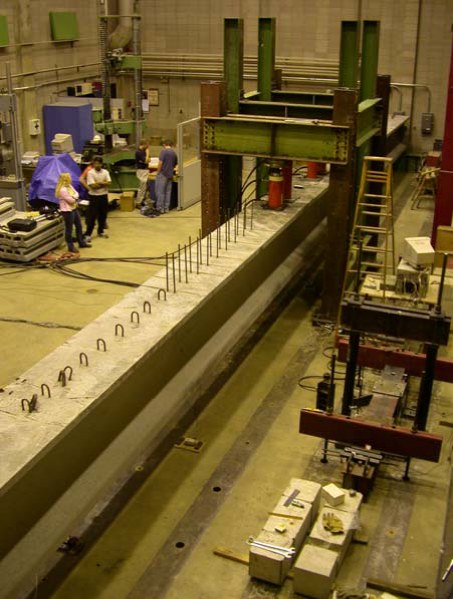
The 3D replay needs WebGL. The measured and calculated curves are shown beside it.
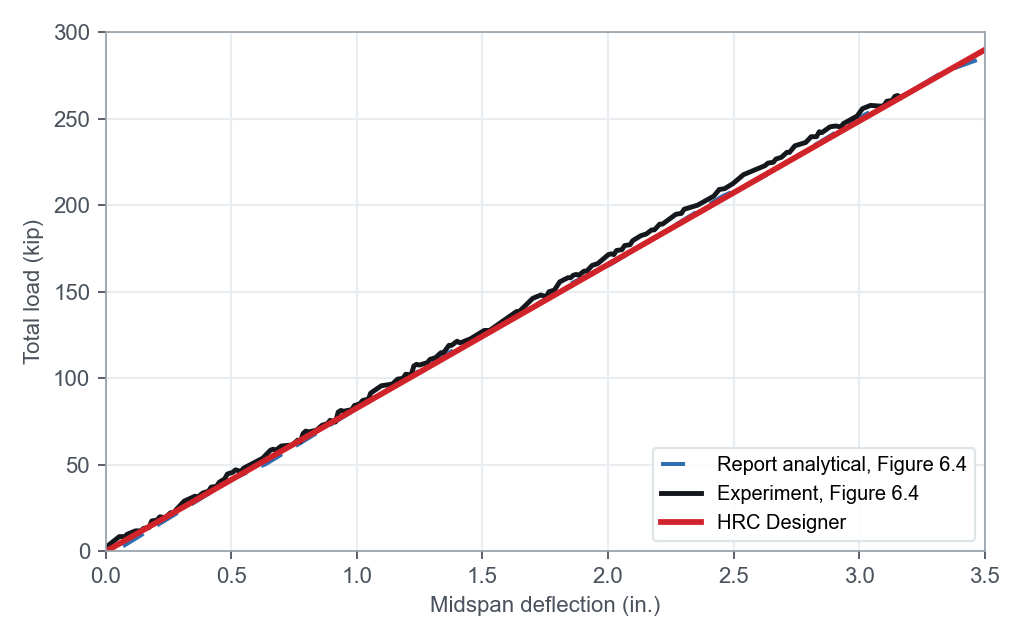
The report analytical curve continues to 11.2 in. and 542 kip, read from Figure 6.4. It is shown over the tested range only and was not used as an input.
ElasticDeflection 0 in.Measured 0 kipHRC Designer 0 kip
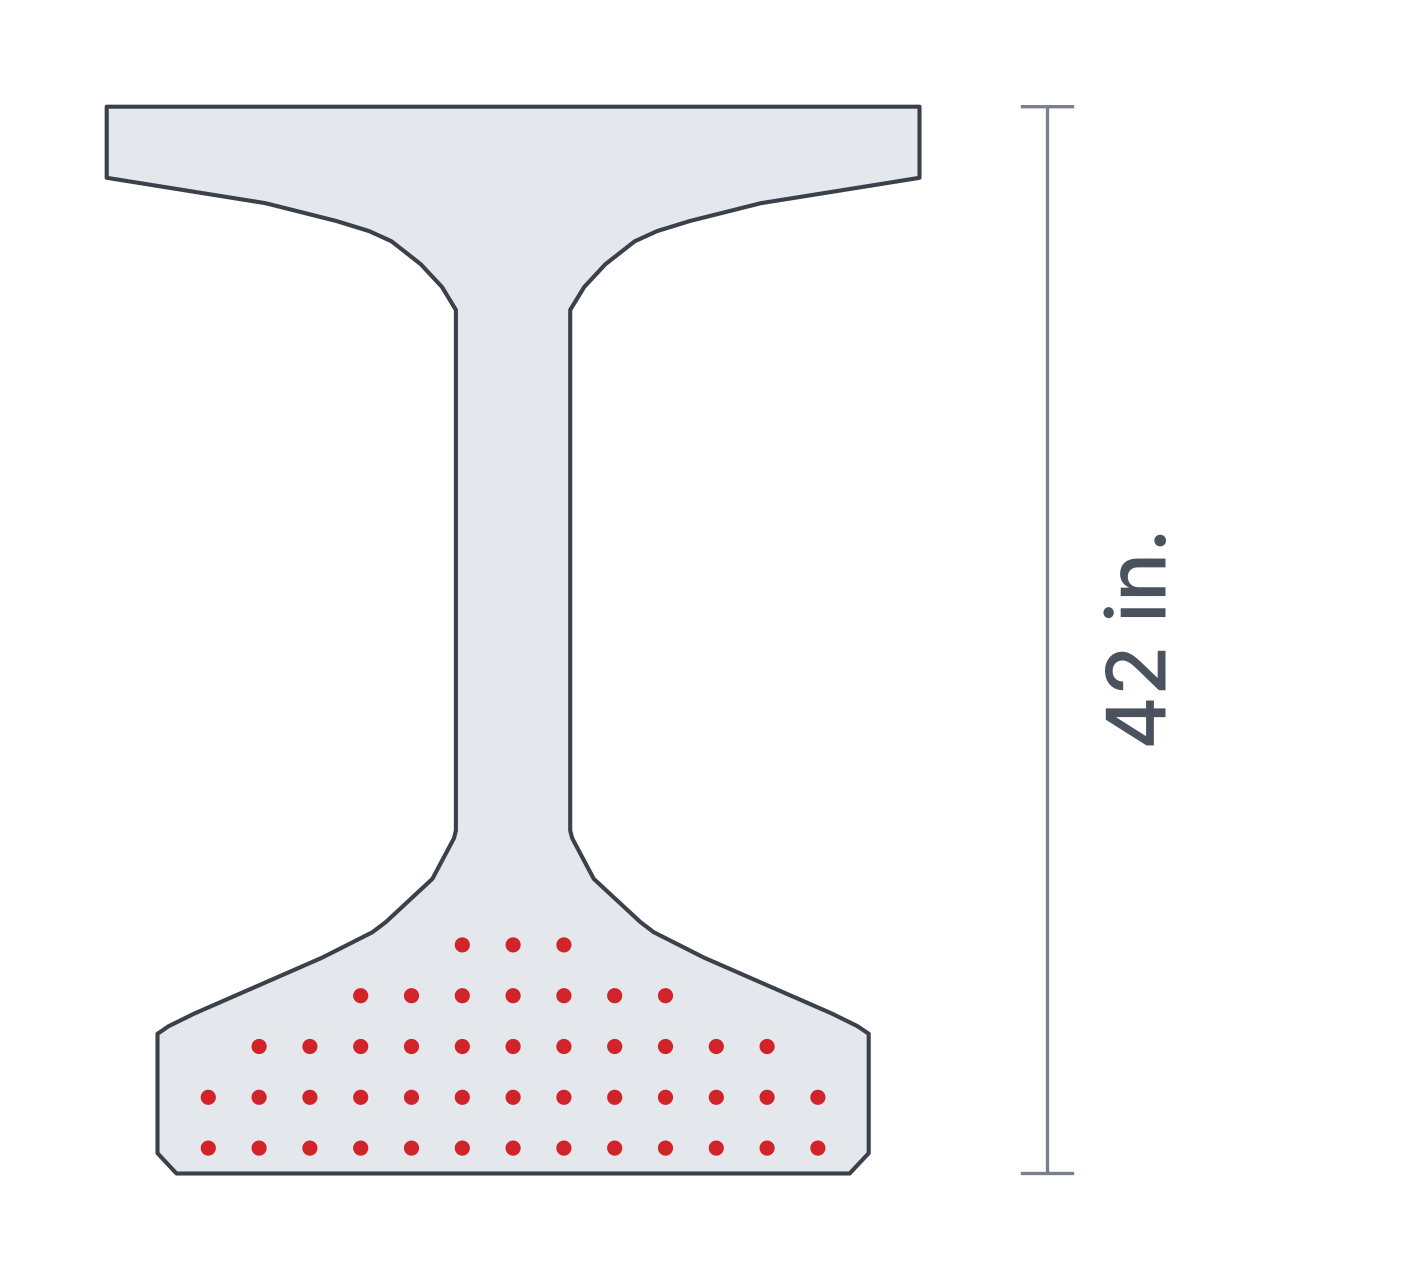
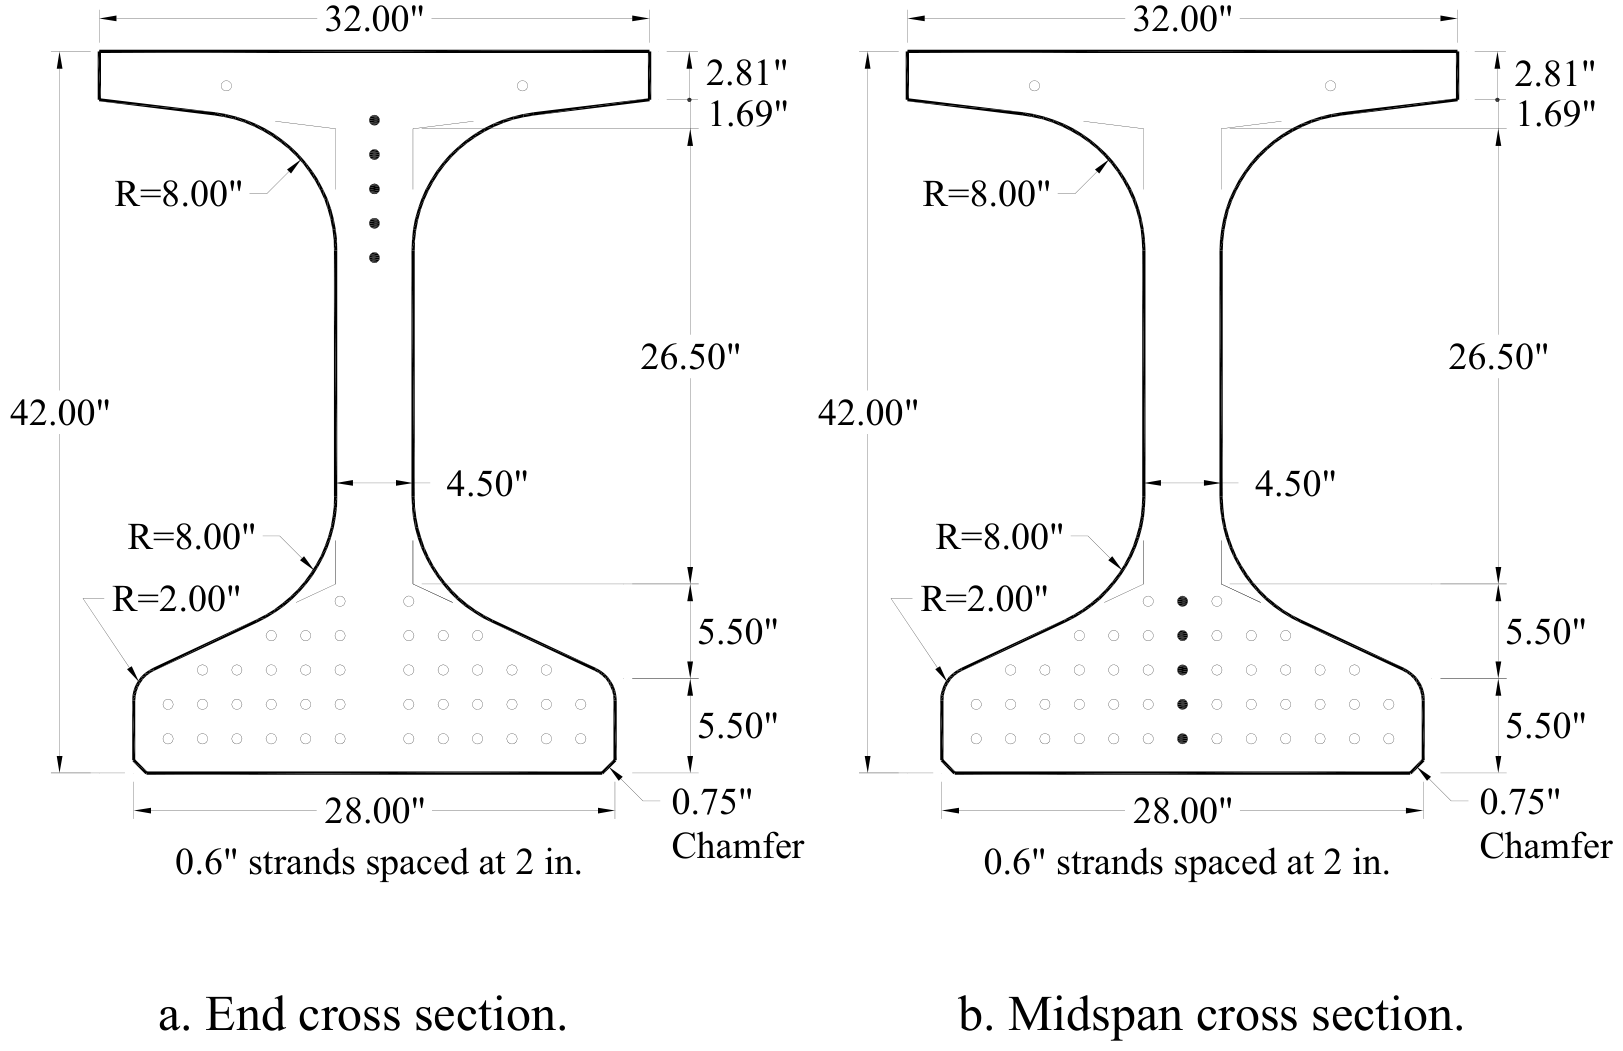
- Section 42 in. bulb-tee, the vector outline of Figure 3.2 with its 8 in. and 2 in. fillets and 0.75 in. chamfers
- Strands 47 of 0.6 in. at midspan in rows of 13, 13, 11, 7 and 3
- Loading 70 ft span, four equal loads at 366, 388, 452 and 474 in.

What these comparisons show
Each case is described with what was predicted and what was set from the girder, so the numbers can be read for what they are.
- Cases 1 and 2 are forward predictions. The tension law came from material tests separate from the girder test, prisms of the same UHPC product for case 1 and direct tension specimens of the girder batch for case 2. Only the post-localization length of case 1 was set on the girder, within bounds of half to one section depth.
- Case 3 uses a law back-calculated from the girder. Its peak moment is a consistency check of the section model and its load-deflection curve a forward check through the actual moment diagram.
- Case 4 covers the service range. The effective prestress was anchored at the observed cracking load, because the report also infers its value from that load with a simple linear stress analysis, and the post-cracking hardening slope was fitted to the same record. The elastic stiffness is a direct prediction.
- Post-localization deflection is not claimed. After one crack opens, a smeared-curvature integration under-predicts deflection, 164 mm against the 234 mm reported at capacity for case 2, and that limit is stated rather than tuned away.
All four cases were computed with the Cross-Sectional Analysis module of HRC Designer in MATLAB R2023a and re-run from their scripts on 21 September 2026, when every output table used by this page matched the stored results. The replays follow the measured records. Crack depth, the cracked length, strand stress and the deflected shape come from the calculated section states mapped through the moment diagram, while crack spacing, the loading frames and the laboratory are drawn for illustration.
Sources and figure rights
- Graybeal, B. A. (2006). Structural behavior of ultra-high performance concrete prestressed I-girders. Report FHWA-HRT-06-115, Federal Highway Administration. fhwa.dot.govFigures 4, 5, 9, 12 and 17 reproduced with citation. Federal Highway Administration report, distribution statement "No restrictions".
- Graybeal, B. A. (2006). Material property characterization of ultra-high performance concrete. Report FHWA-HRT-06-103, Federal Highway Administration. fhwa.dot.govFigure 40 reproduced and its prism records digitized. Federal Highway Administration report, distribution statement "No restrictions".
- El-Helou, R. G., and Graybeal, B. A. (2022). Flexural behavior and design of ultrahigh-performance concrete beams. Journal of Structural Engineering, 148(4), 04022013. doi:10.1061/(ASCE)ST.1943-541X.0003246Figs. 2, 3, 4, 5(a), 6(a) and 14(a) reproduced under the Creative Commons Attribution 4.0 license, cropped without other changes.
- Fang, Z., Tian, X., and Peng, F. (2023). Flexural strength of prestressed ultra-high-performance concrete beams. Engineering Structures, 279, 115612. doi:10.1016/j.engstruct.2023.115612Curves of Figs. 6 and 8(a) digitized. No figure is reproduced.
- Wipf, T. J., Phares, B. M., Sritharan, S., Degen, B. E., and Giesmann, M. T. (2009). Design and evaluation of a single-span bridge using ultra-high performance concrete. IHRB Project TR-529, Iowa State University. intrans.iastate.eduFigures 3.2, 4.3, 4.4 and 6.4 reproduced from the public report with citation.