Hybrid beam analysis
Design · closed form · rectangular section
Moment-curvature with limit states, load-deflection and internal force profiles of a rectangular FRC, UHPC or plain concrete beam with top and bottom rebar. The material laws come from an inverse analysis or from your own data.
UHPC limit states and design. Patel, D. D., Pleesudjai, C., Neithalath, N., and Mobasher, B. (2026). Limit-state based design of hybrid reinforced UHPC flexural beams using parametric modeling. Engineering Structures, 357, 122353. doi:10.1016/j.engstruct.2026.122353
Closed-form formulation. Pleesudjai, C., Patel, D. D., and Mobasher, B. (2023). Generalized nonlinear moment-curvature model for serviceability-based design of hybrid reinforced concrete. Journal of Structural Engineering, 149(12), 04023188. doi:10.1061/JSENDH.STENG-12235
What you need
- Beam span, section, cover, bar sizes and counts, and the loading arrangement.
- The tension and compression laws of the matrix: an output workbook from an inverse-analysis module, or values you type.
- The rebar law: modulus, yield strength, ultimate stress and strain.
Step 1 · Geometry and reinforcement layout
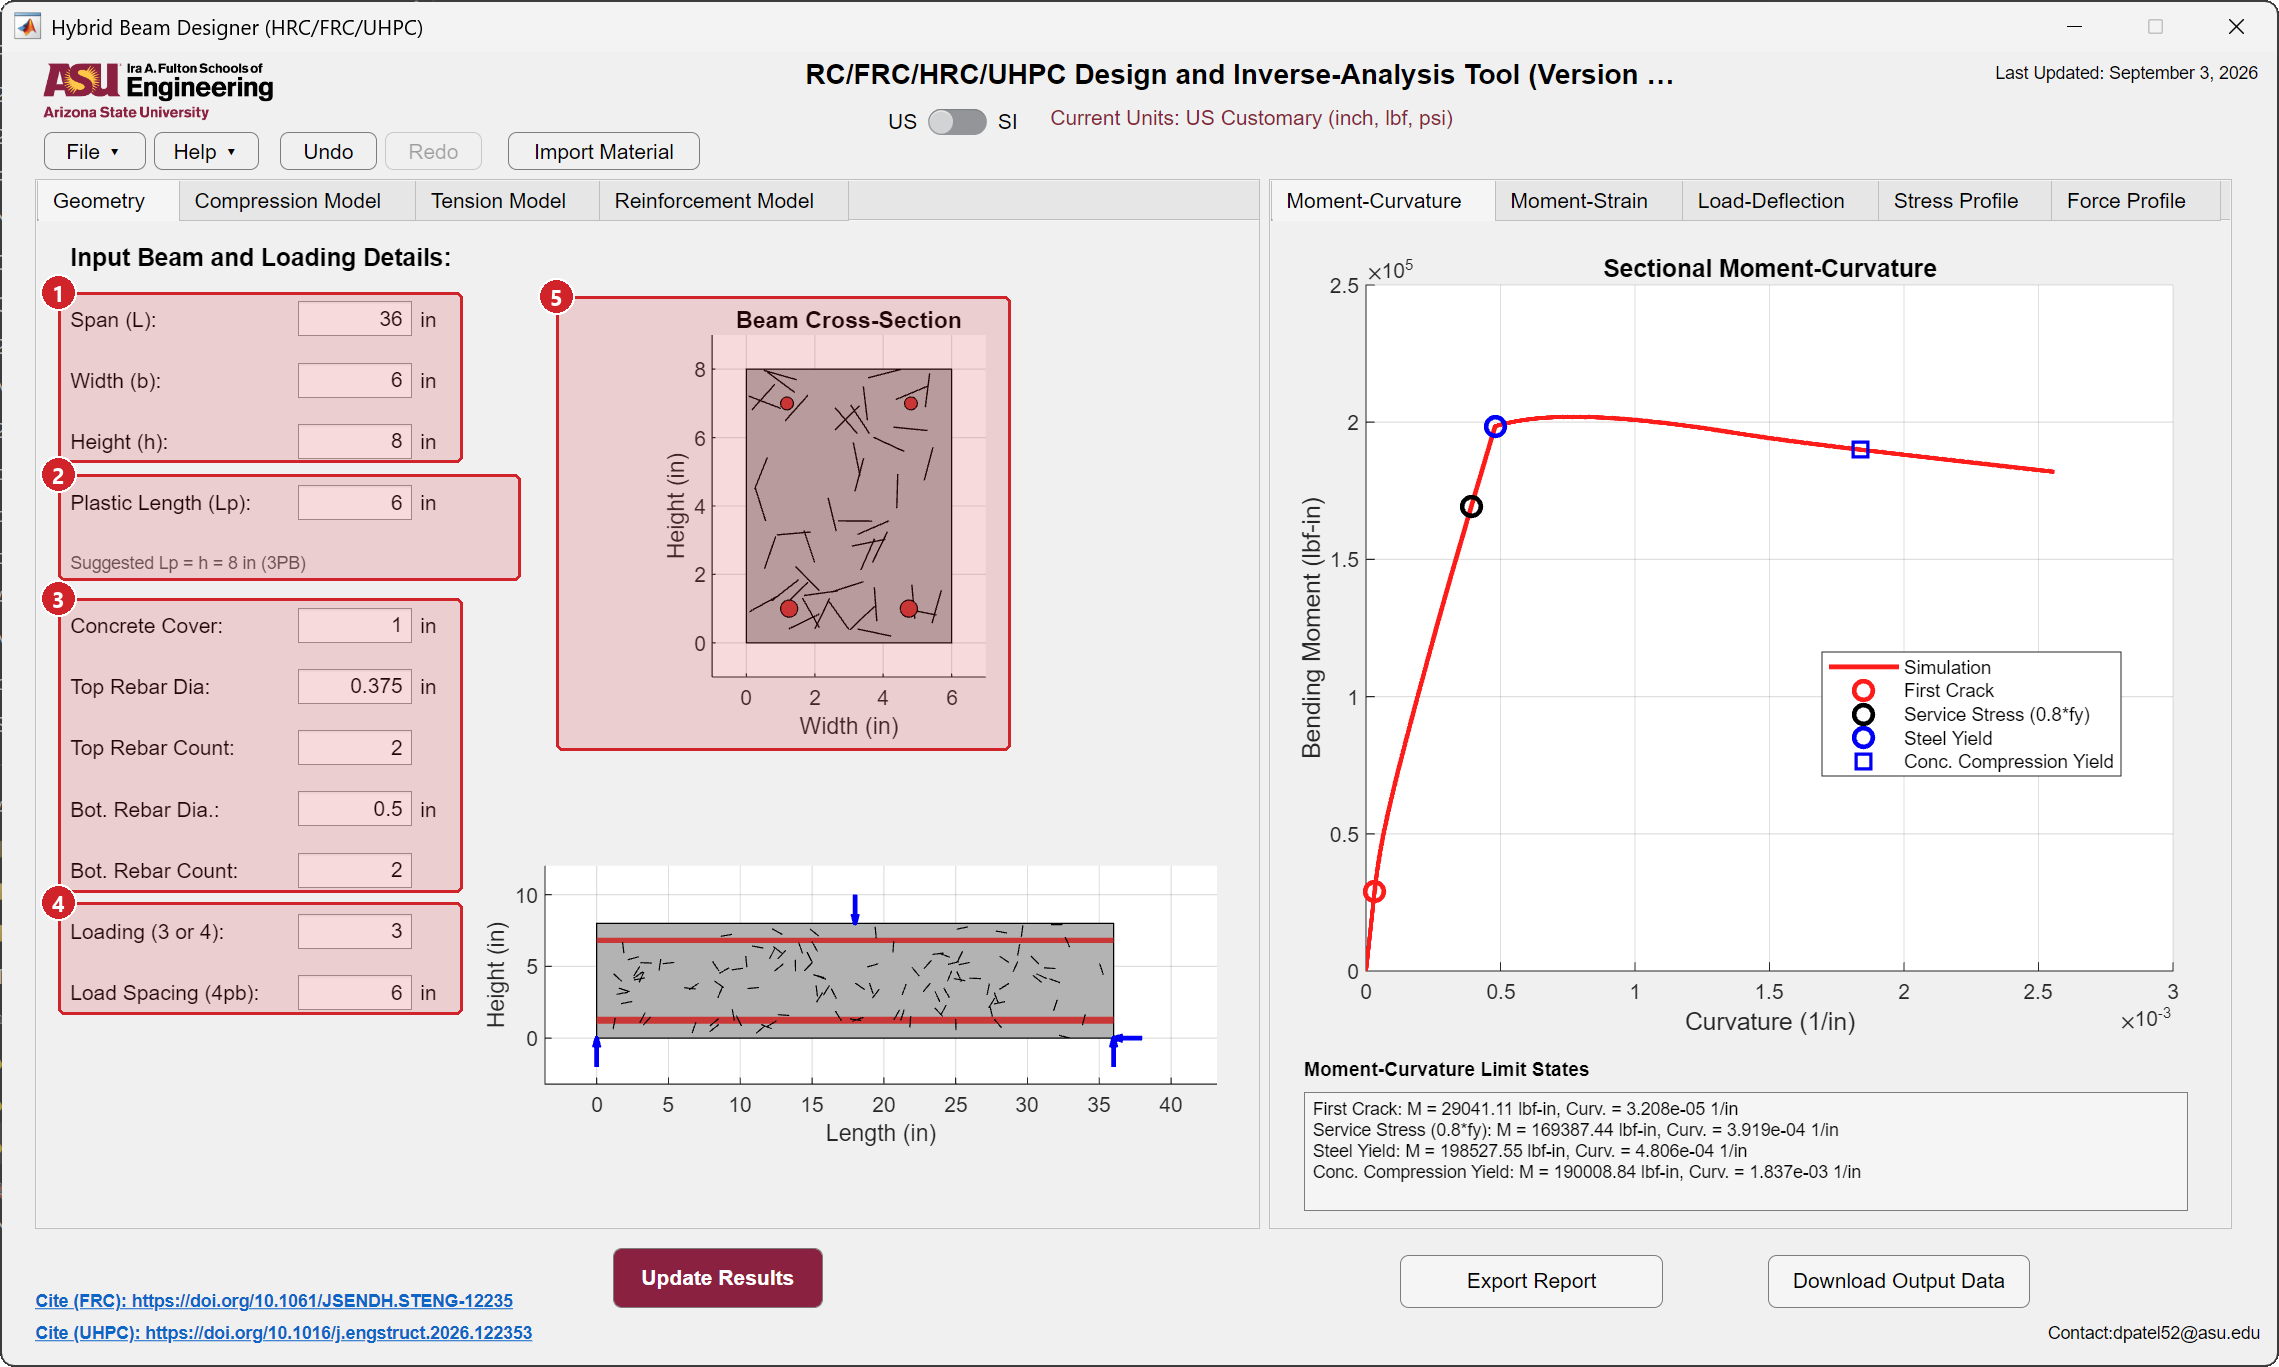
- Span, width and height.
- Plastic length, with the suggested value under the box. Localization in a beam with rebar is discussed under From moment-curvature to load-deflection.
- Cover and bars. Concrete cover to the bar center, then diameter and count of the top bars and of the bottom bars. Enter a count of 0 to remove a layer. The bar areas and reinforcement ratios are written to the output workbook.
- Loading and load spacing. 3 or 4 point bending.
- Section drawing. Bars drawn to scale at the cover you entered. Check that they sit where you intend.
| Input | Symbol | Unit | Default |
|---|---|---|---|
| Span (L) | \(L\) | mm | 914 |
| Width (b), Height (h) | \(b, h\) | mm | 152, 203 |
| Plastic Length (Lp) | \(L_p\) | mm | 152 |
| Concrete Cover | \(c\) | mm | 25.4 |
| Top Rebar Dia, Count | mm, count | 9.5, 2 | |
| Bot. Rebar Dia, Count | mm, count | 12.7, 2 | |
| Loading (3 or 4), Load Spacing | 3 |
| Input | Symbol | Unit | Default |
|---|---|---|---|
| Span (L) | \(L\) | in | 36 |
| Width (b), Height (h) | \(b, h\) | in | 6, 8 |
| Plastic Length (Lp) | \(L_p\) | in | 6 |
| Concrete Cover | \(c\) | in | 1 |
| Top Rebar Dia, Count | in, count | 0.375, 2 | |
| Bot. Rebar Dia, Count | in, count | 0.5, 2 | |
| Loading (3 or 4), Load Spacing | 3 |
Step 2 · Bring in the matrix laws
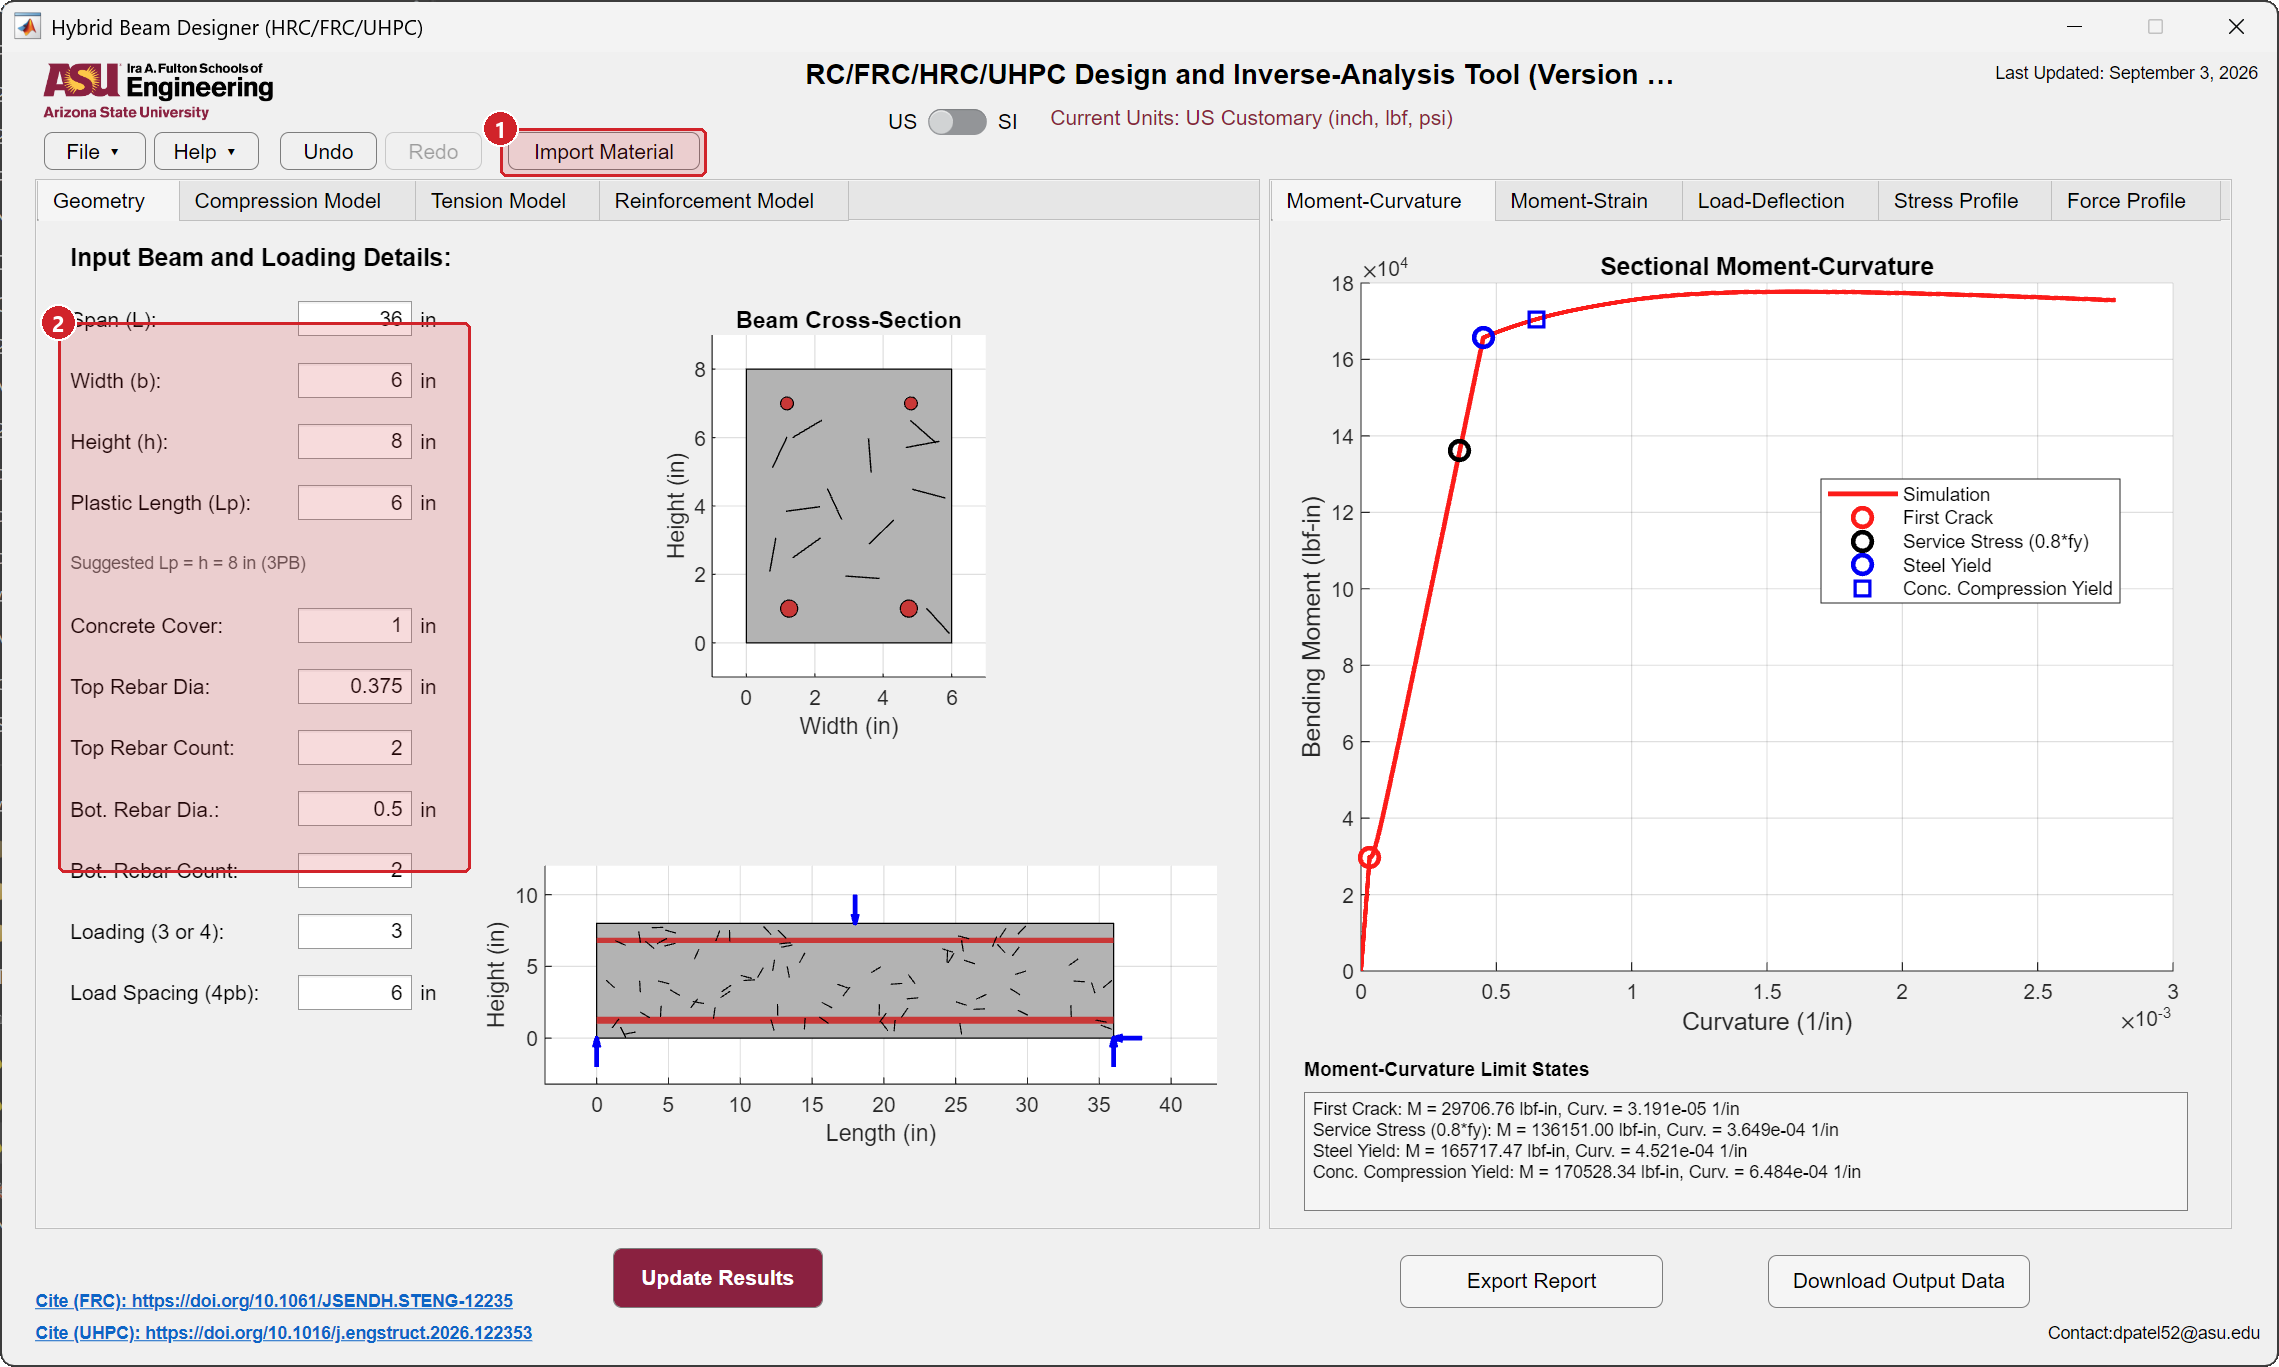
- Import Material (also under File) reads the
Input_Parameterssheet of an output workbook written by the ASTM C1609, EN 14651 or TRC module. The tension and compression laws are filled in and converted to the current unit system. The geometry is untouched. - Or type the laws on the Tension Model and Compression Model tabs, which are identical to those of the ASTM C1609 module. The suggested values from the compressive strength are available here too.
The example workbook used above is material_ASTM_C1609_example.xlsx.
Step 3 · Reinforcement model
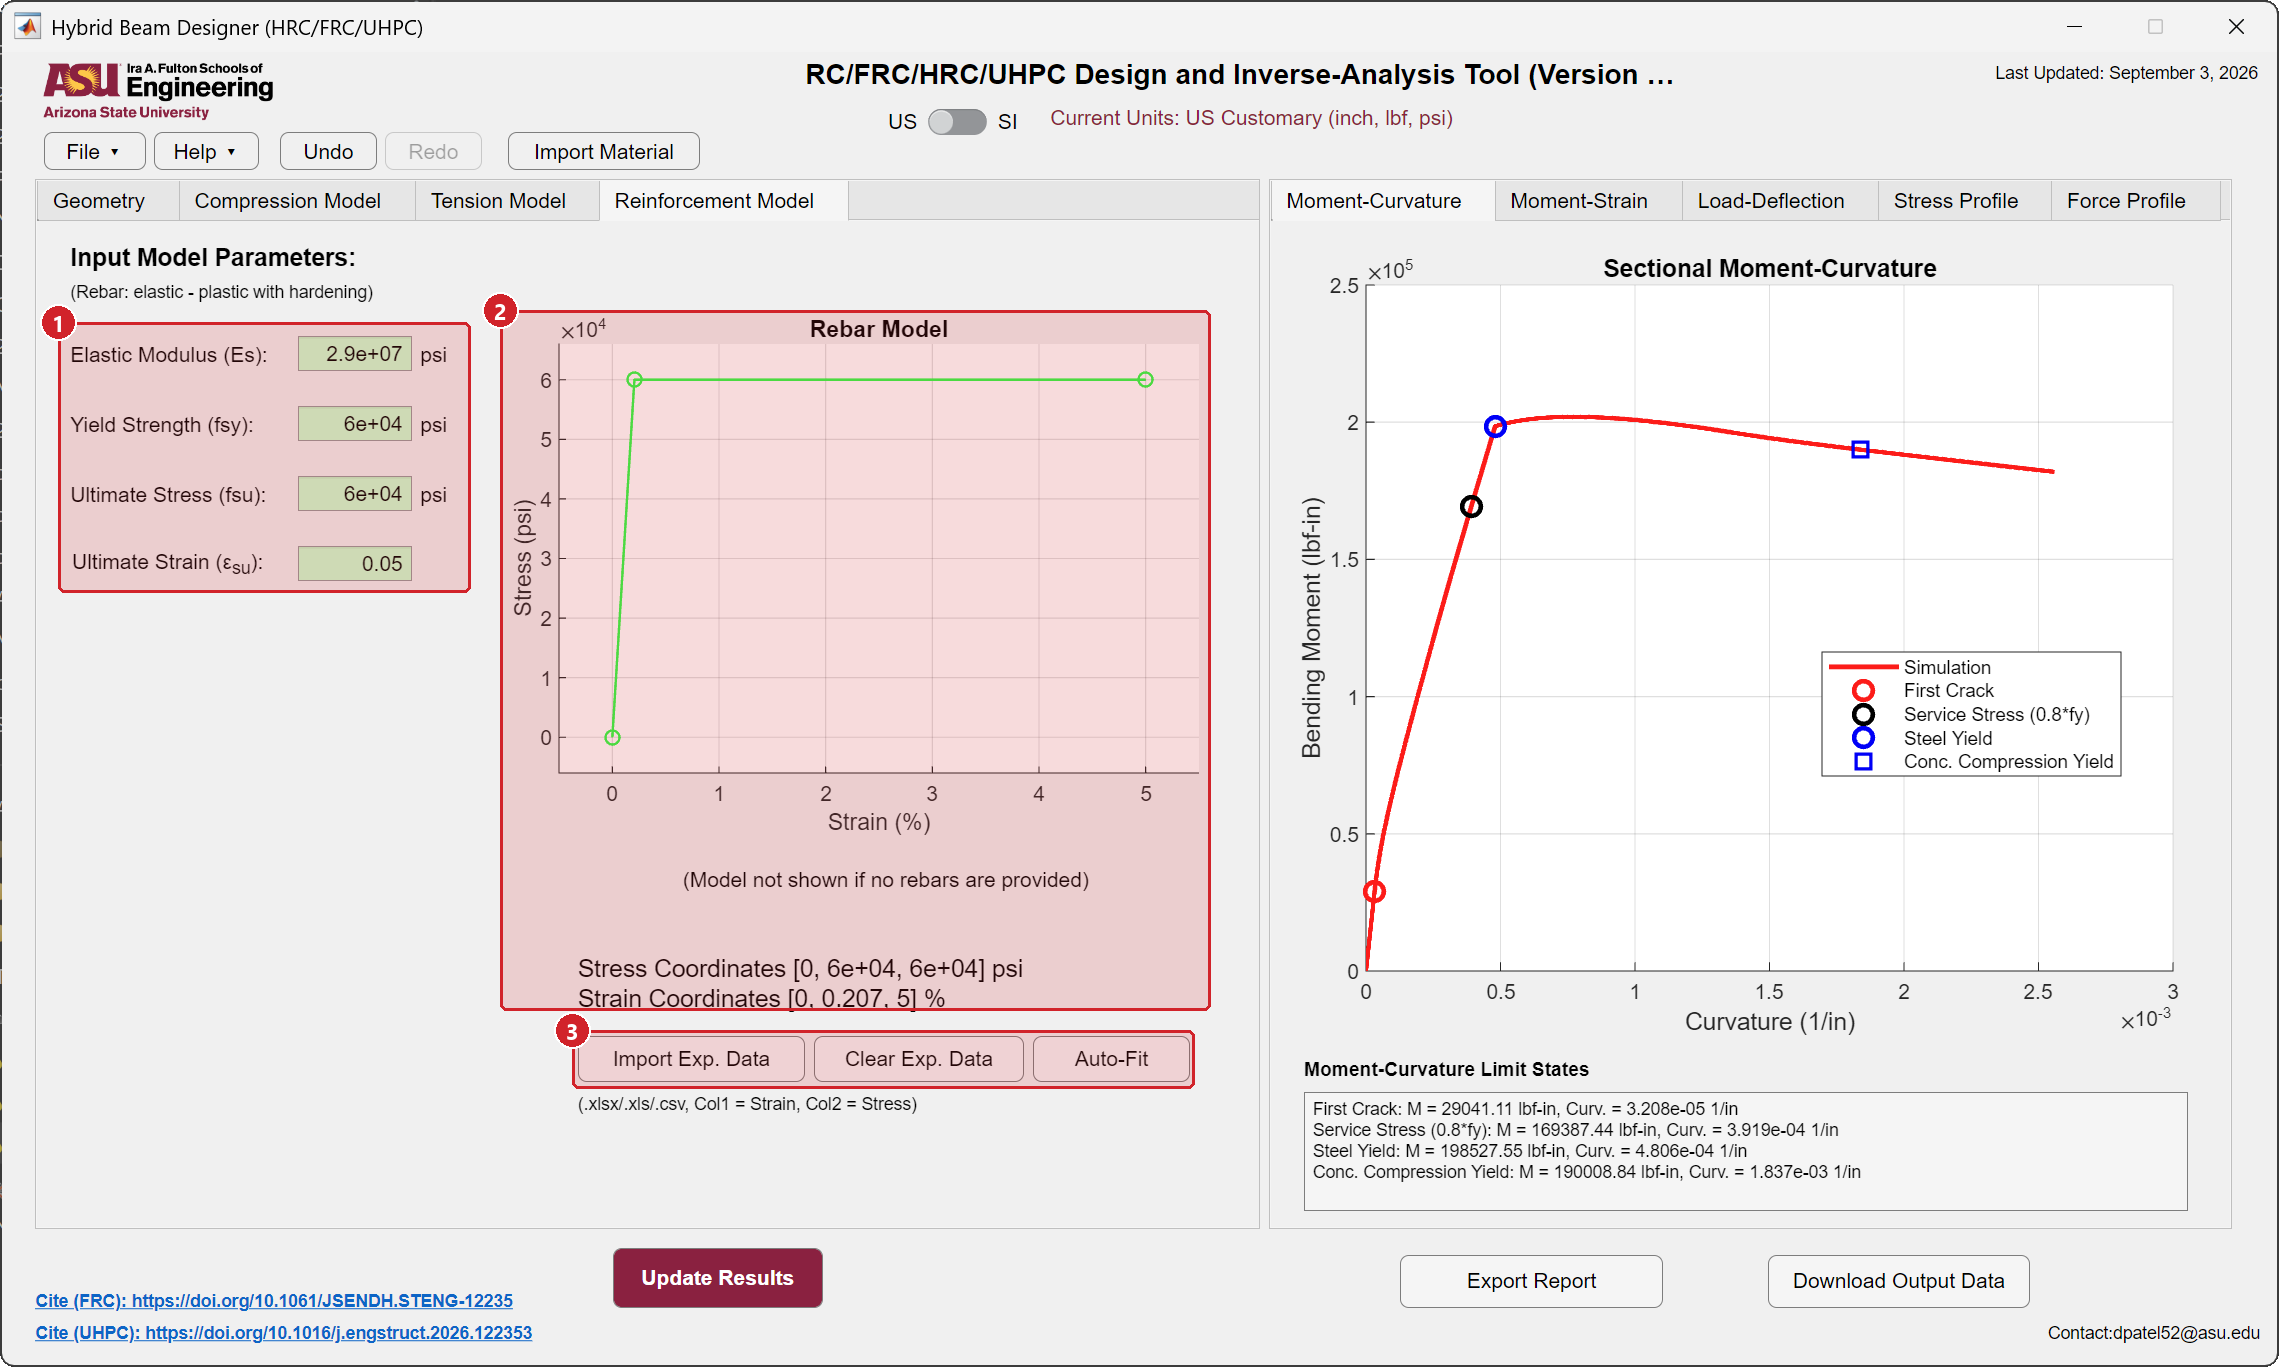
- Rebar law. Modulus \(E_s\), yield strength \(f_{sy}\), ultimate stress \(f_{su}\) and ultimate strain \(\varepsilon_{su}\). Set \(f_{su} = f_{sy}\) for an elastic-perfectly plastic bar.
- The plot. Three coordinates listed under it. Drag to adjust. The plot is hidden when both bar counts are zero.
- Import a measured bar curve and fit the law to it, optional.
Step 4 · Update Results and read the limit states
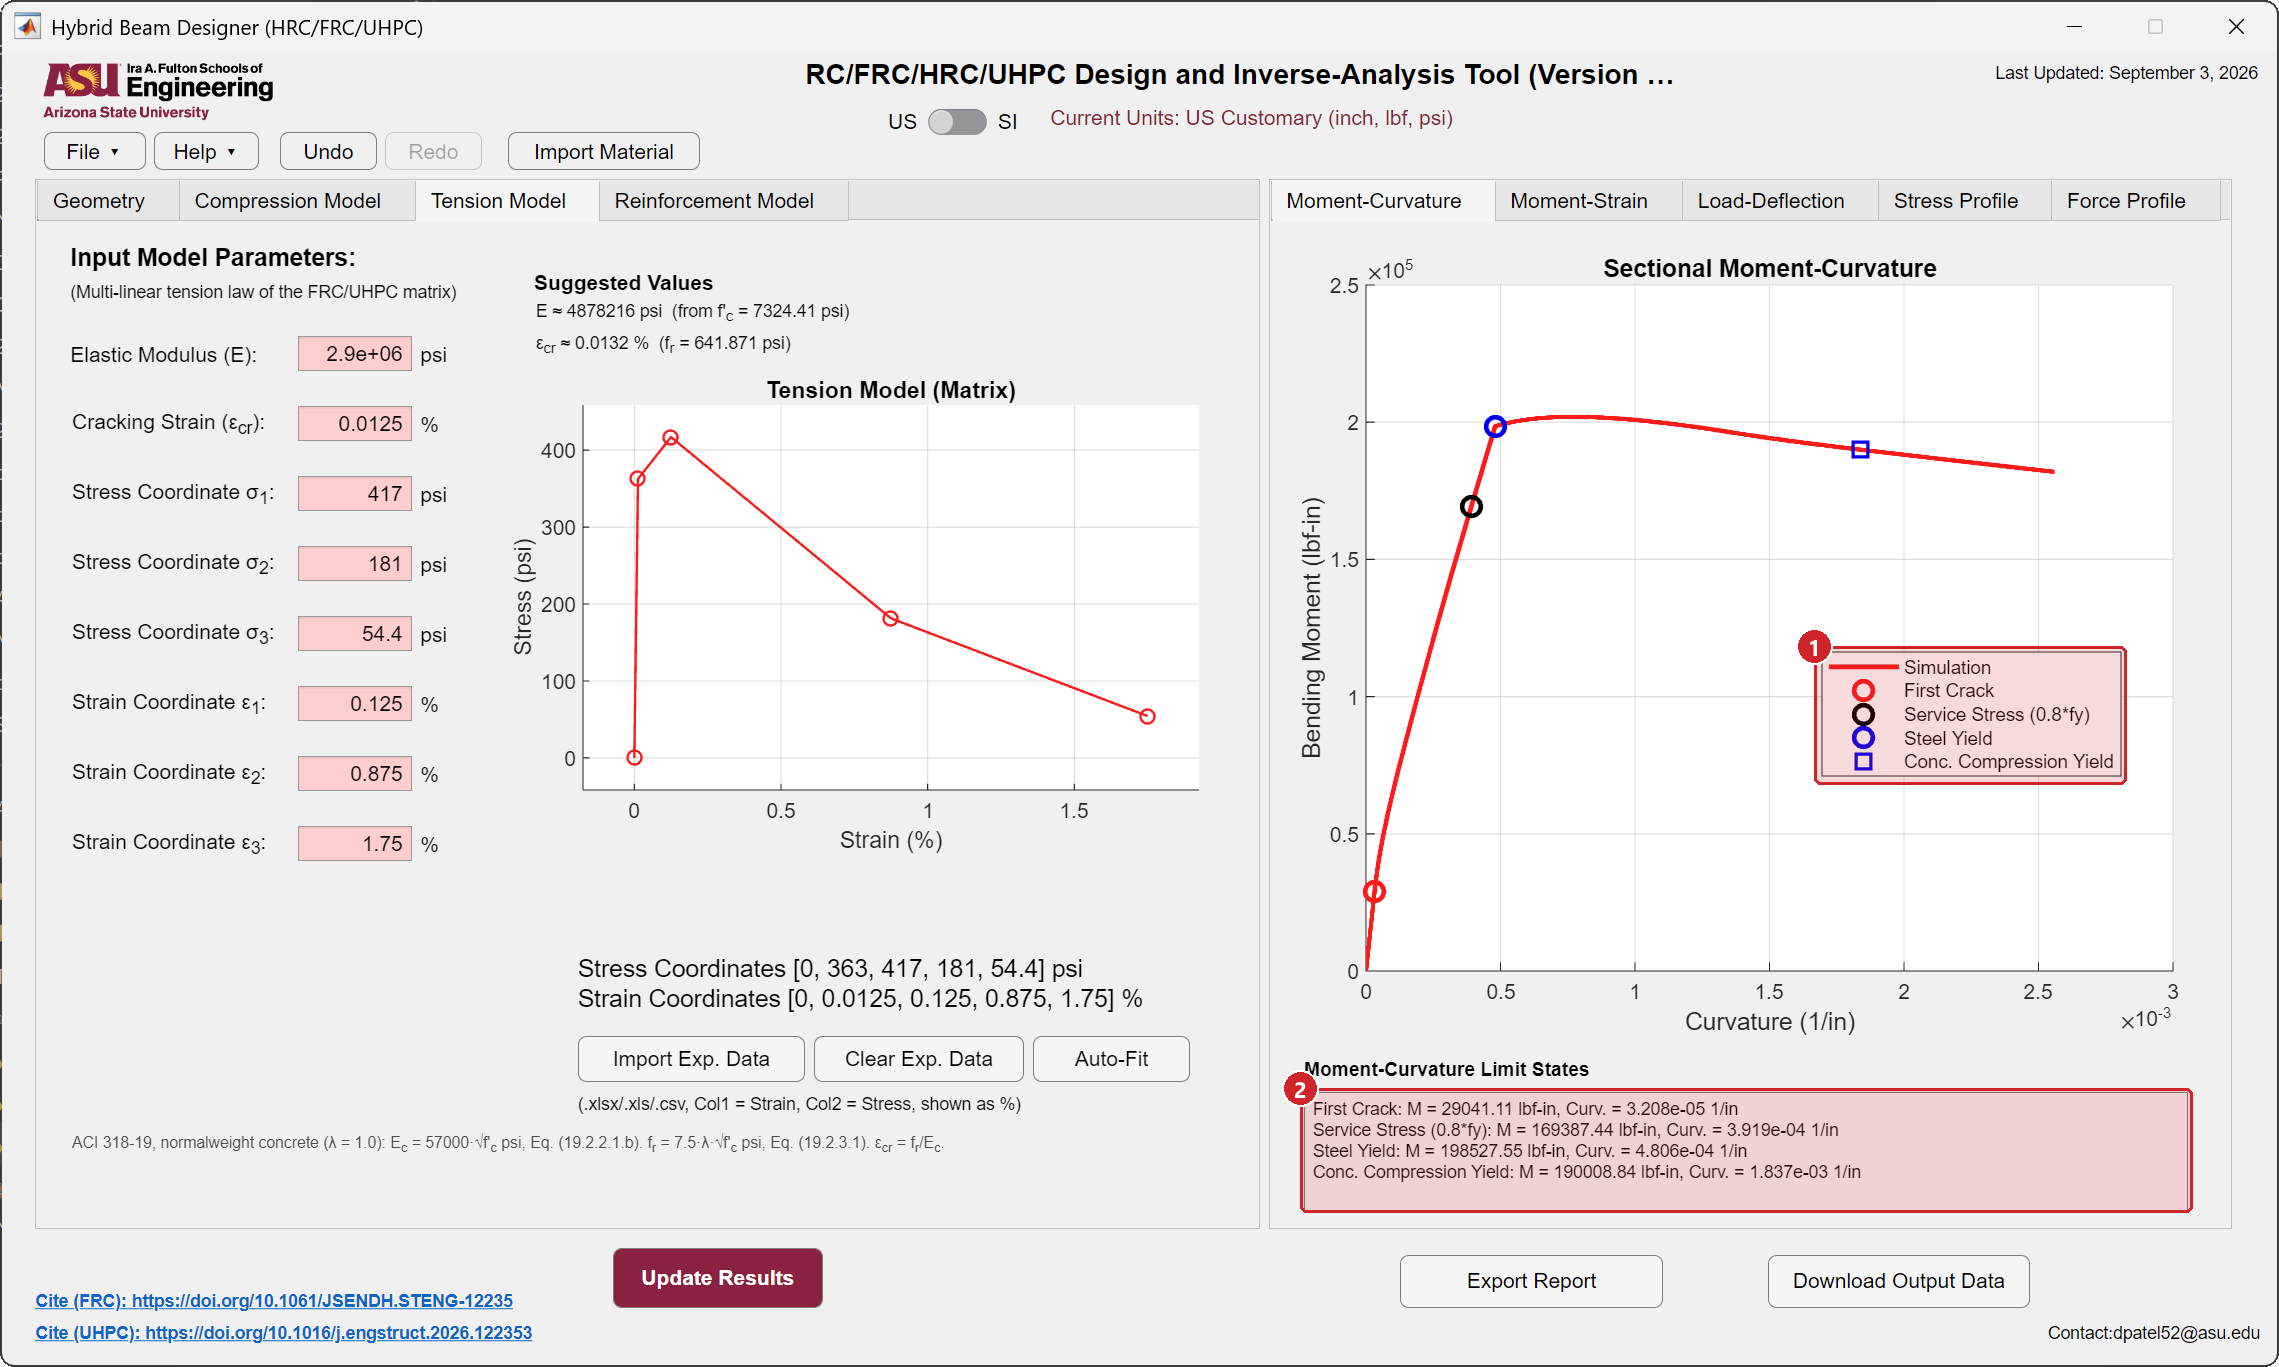
- Limit states on the curve. First crack, service stress at 80 percent of the yield strength, steel yield and compression yield, each with its marker. Concrete crushing, bar rupture and tension exhaustion are added when they occur before the end of the curve.
- Their values. Moment and curvature of every limit state that was reached.
The Moment-Strain tab shows the same response against the bottom strain, and the Load-Deflection tab converts it to the beam with the loading and plastic length you entered.
Step 5 · Stress and force profiles
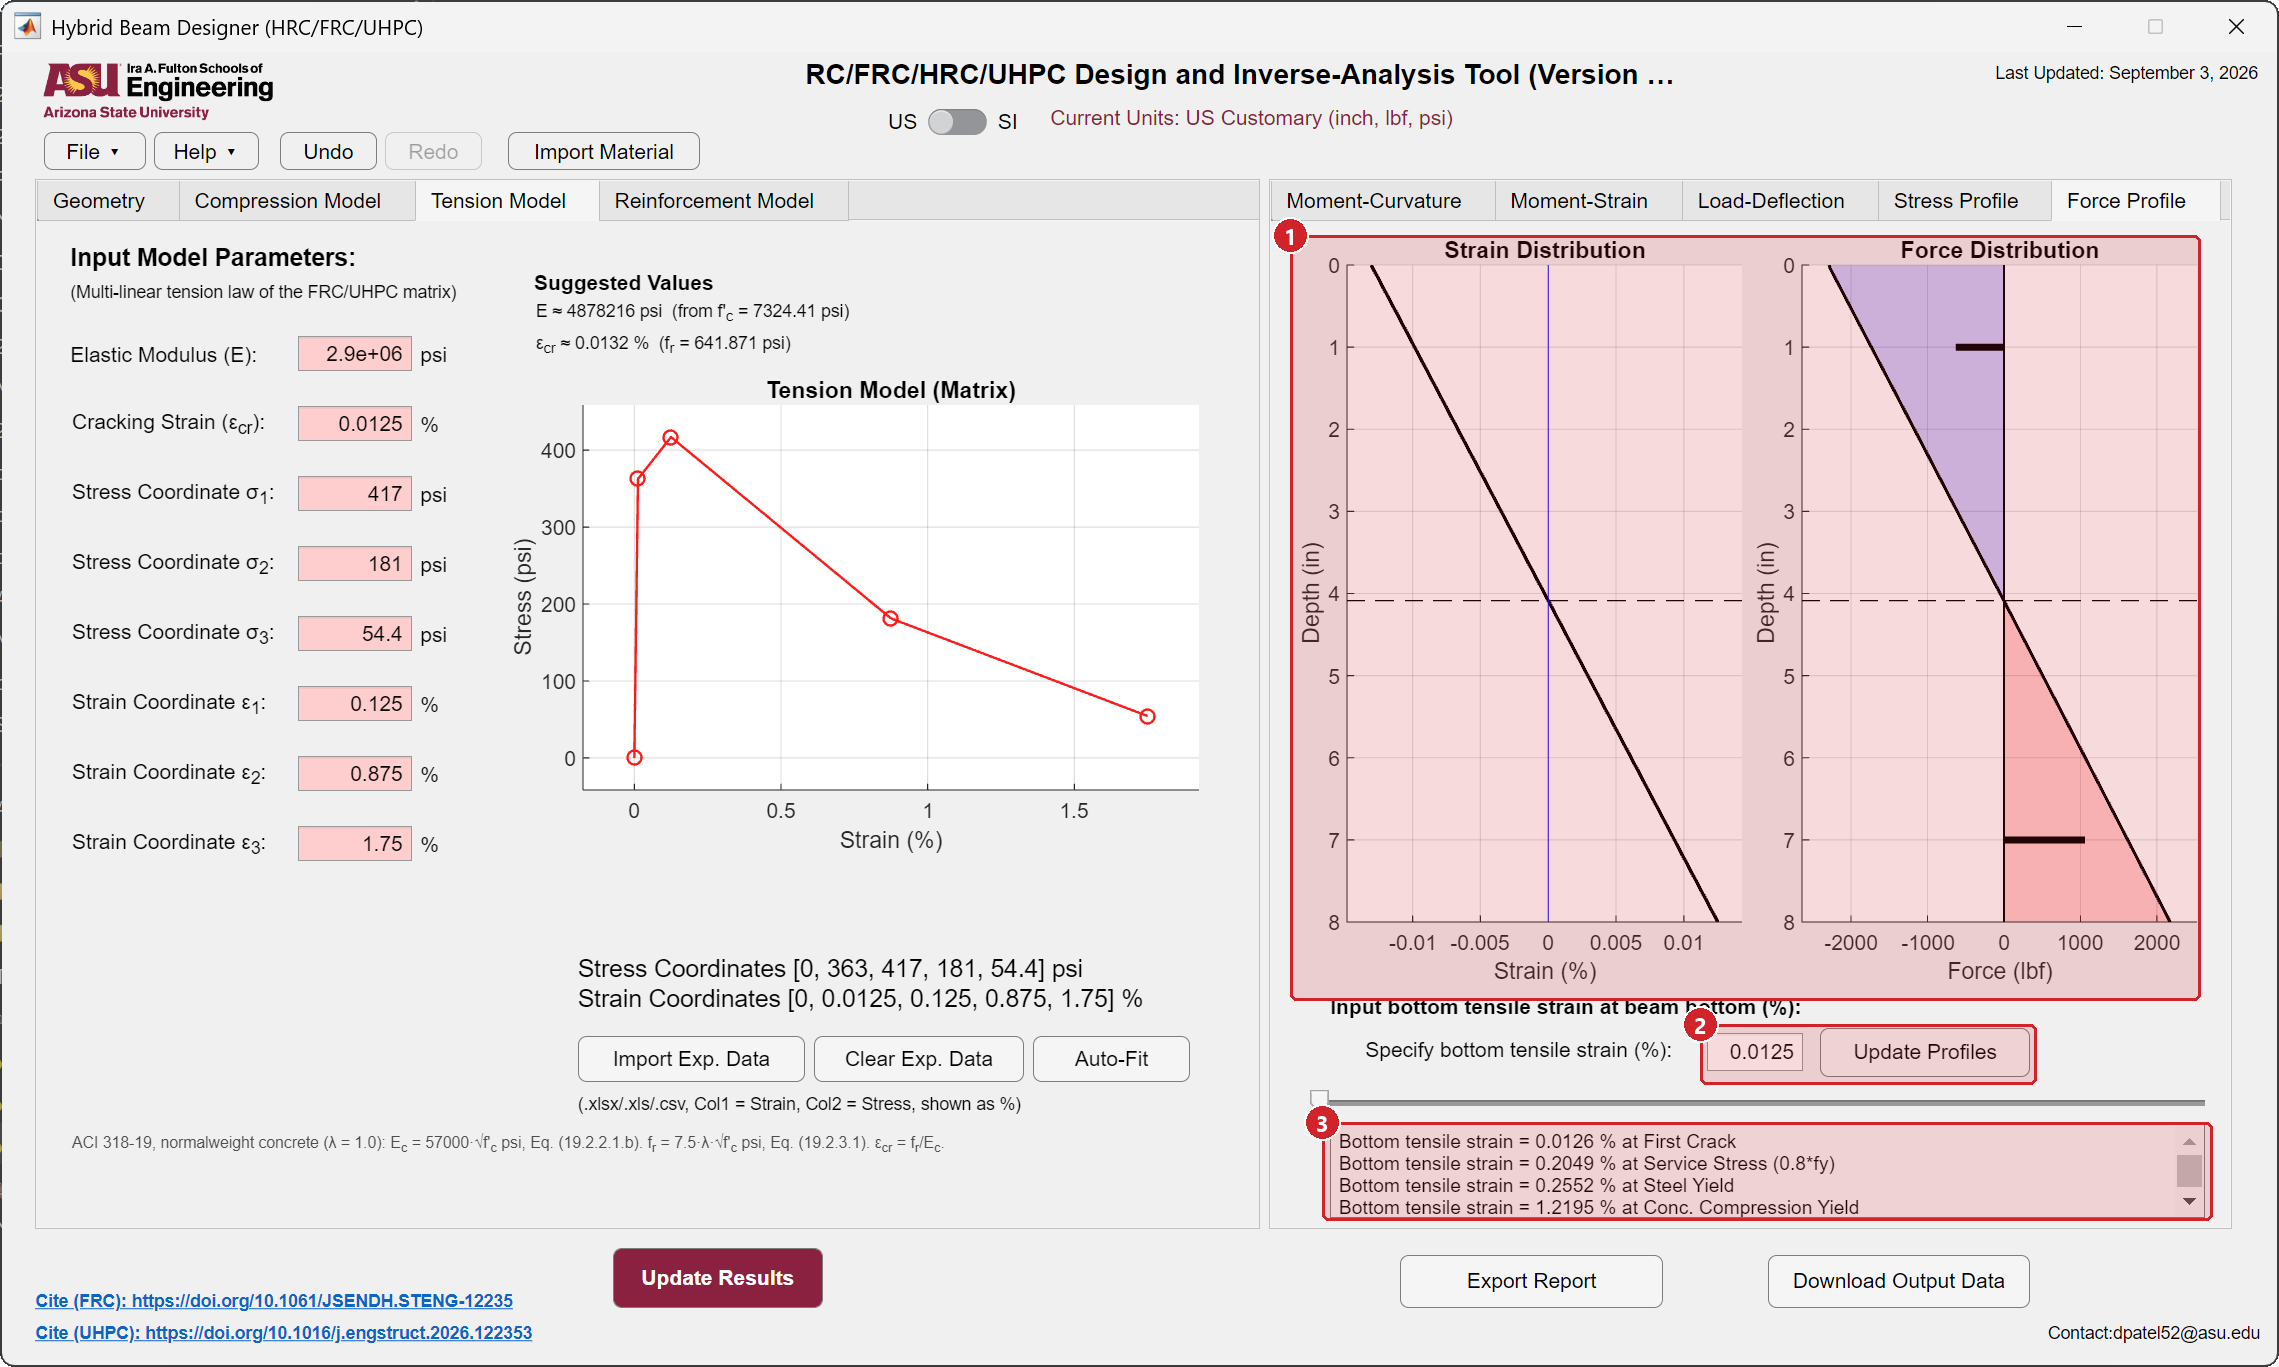
- Distributions. Strain through the depth on the left, the force distribution on the right: compression above the neutral axis, tension below it, with the bar forces drawn as horizontal bars at the bar depths.
- Bottom strain and Update Profiles. Choose the strain at which the profiles are drawn.
- States. The bottom strain at each limit state, so you can jump to it.
The Stress Profile tab draws the stresses instead of the forces. Comparing the two at the peak shows how much of the tension force the fibers carry beside the bars.
Step 6 · Export and save
Export Report, Download Output Data and File → Save work as in every module. The output workbook adds a Reinforcement_Data sheet and the bar areas and ratios under Input_Parameters.
Parametric study
Every input is one undo step, and the plots redraw as you drag a vertex. To compare two bar layouts: run the first, export the report, change the counts, press Update Results, export again. For a systematic sweep of fiber dosage or bar area use the same fitted matrix workbook with a series of geometries and collect the Limit_States from the reports.