From moment-curvature to load-deflection
Background · 3 of 5
A flexural test measures load and deflection, not moment and curvature. The software converts one into the other with statics and the moment-area theorem, and treats the concentration of cracking after the peak with a plastic length.
Plastic length and localization. Patel, D. D., Pleesudjai, C., Neithalath, N., and Mobasher, B. (2026). Limit-state based design of hybrid reinforced UHPC flexural beams using parametric modeling. Engineering Structures, 357, 122353. doi:10.1016/j.engstruct.2026.122353
Validation on notched and unnotched beams. Patel, D., Pleesudjai, C., Bakhshi, M., Nasri, V., and Mobasher, B. (2025). Back-calculation of mechanical properties of fiber-reinforced concrete in tunnel lining segments. Structural Concrete, 26, 6019–6040. doi:10.1002/suco.70052
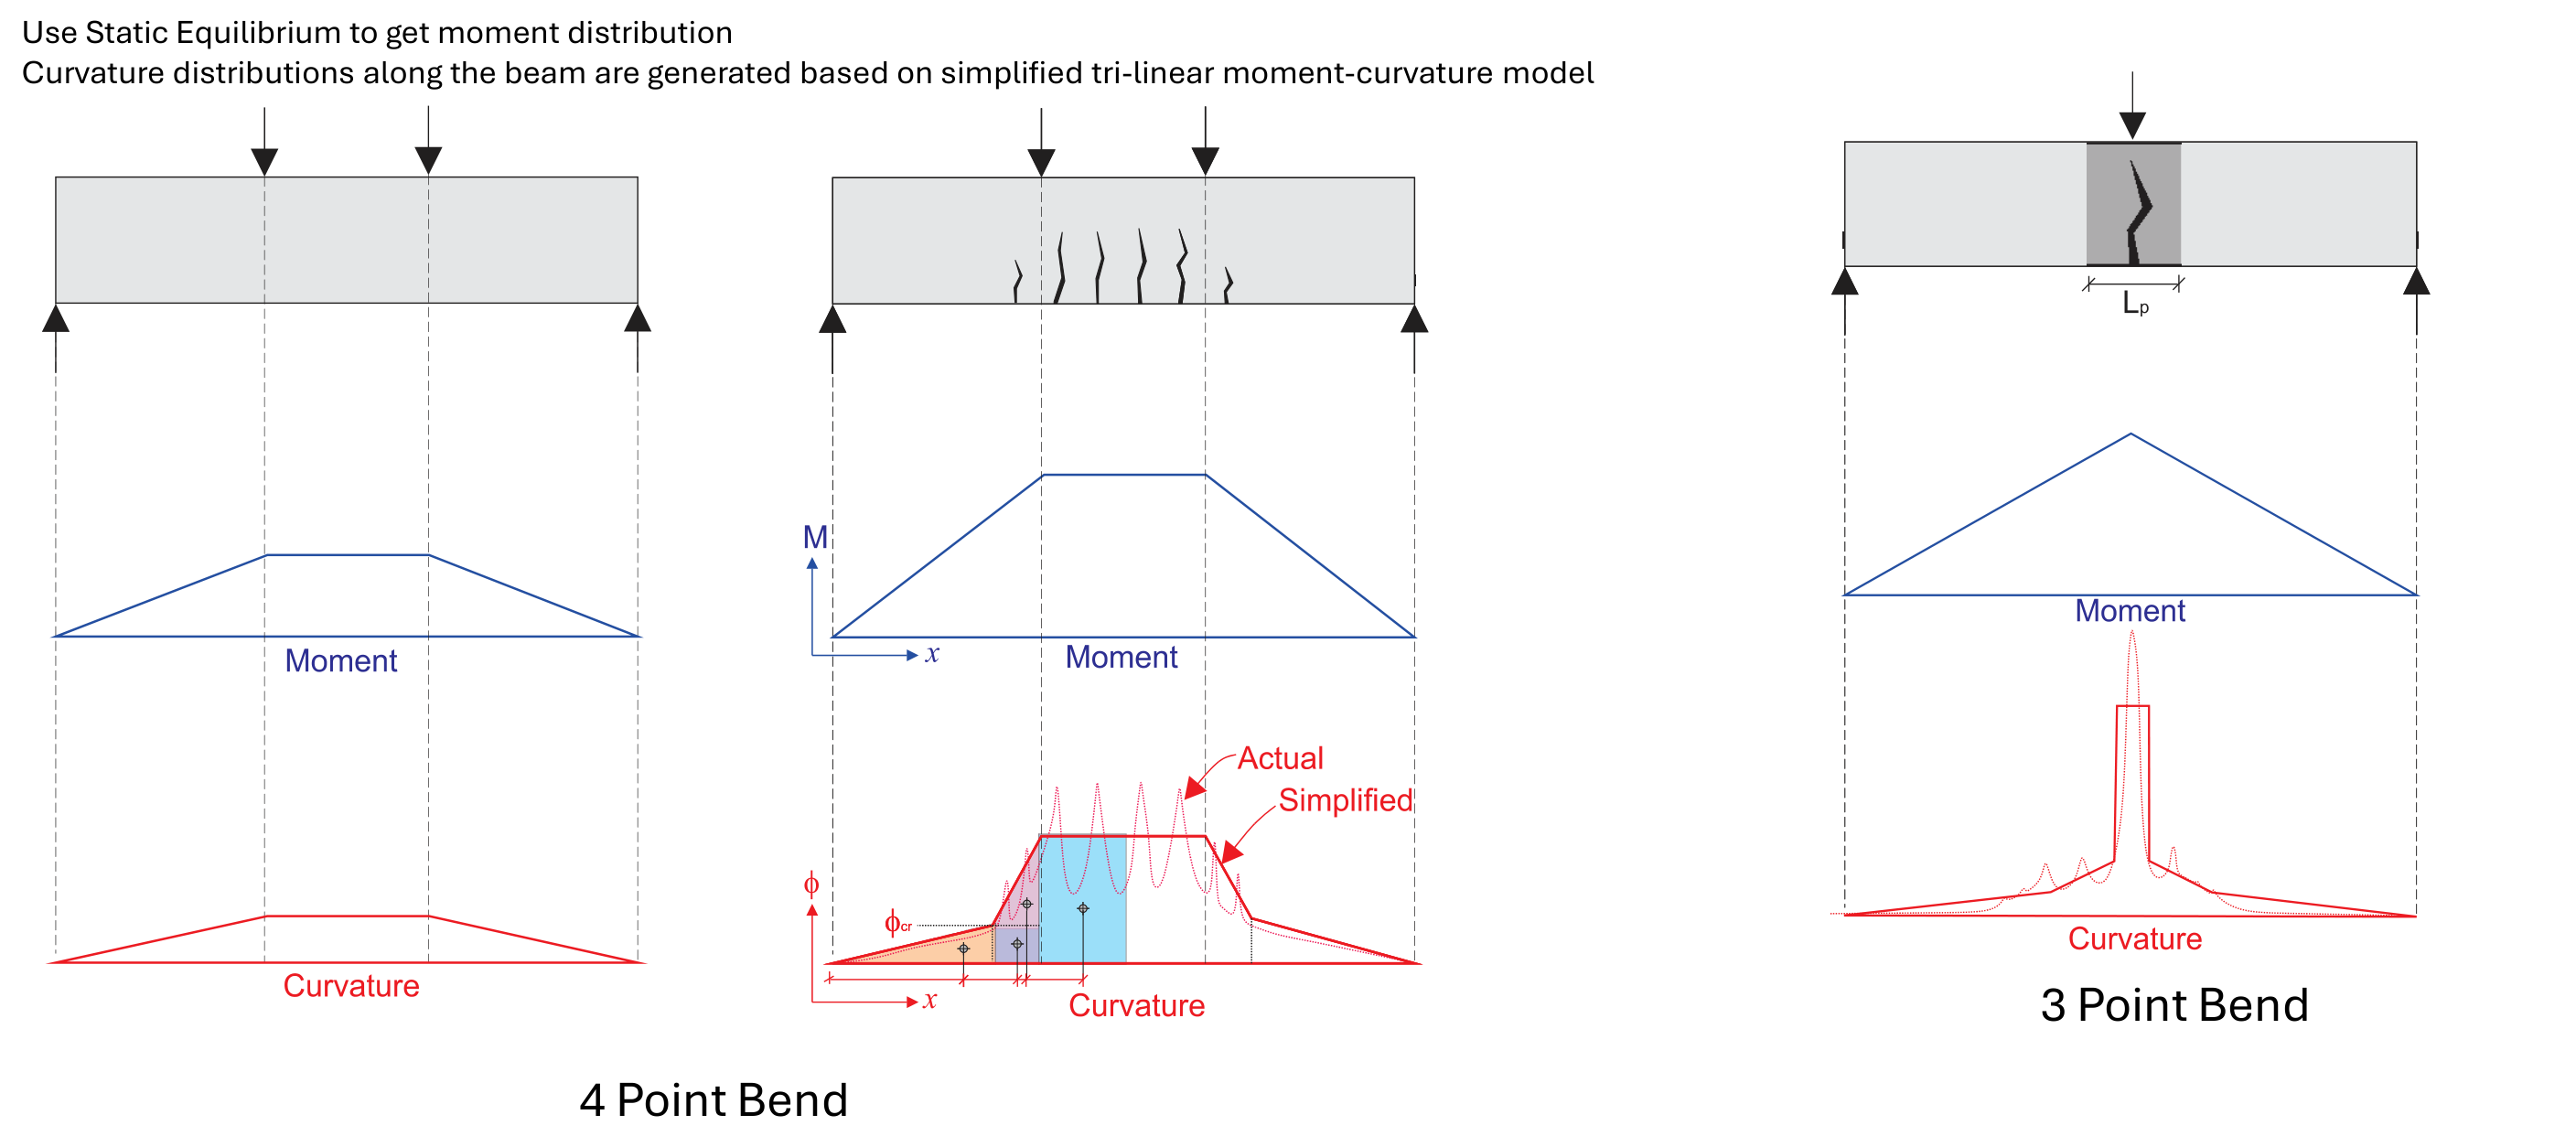
Load from moment
Static equilibrium gives the moment at midspan for the applied load \(P\). In 4-point bending with the loads at a distance \(S_2\) apart, and in 3-point bending:
The moment diagram is known along the whole span, so every section has a moment and, through the moment-curvature curve, a curvature.
Deflection from curvature
The midspan deflection is the first moment of the curvature diagram about the support (moment-area theorem):
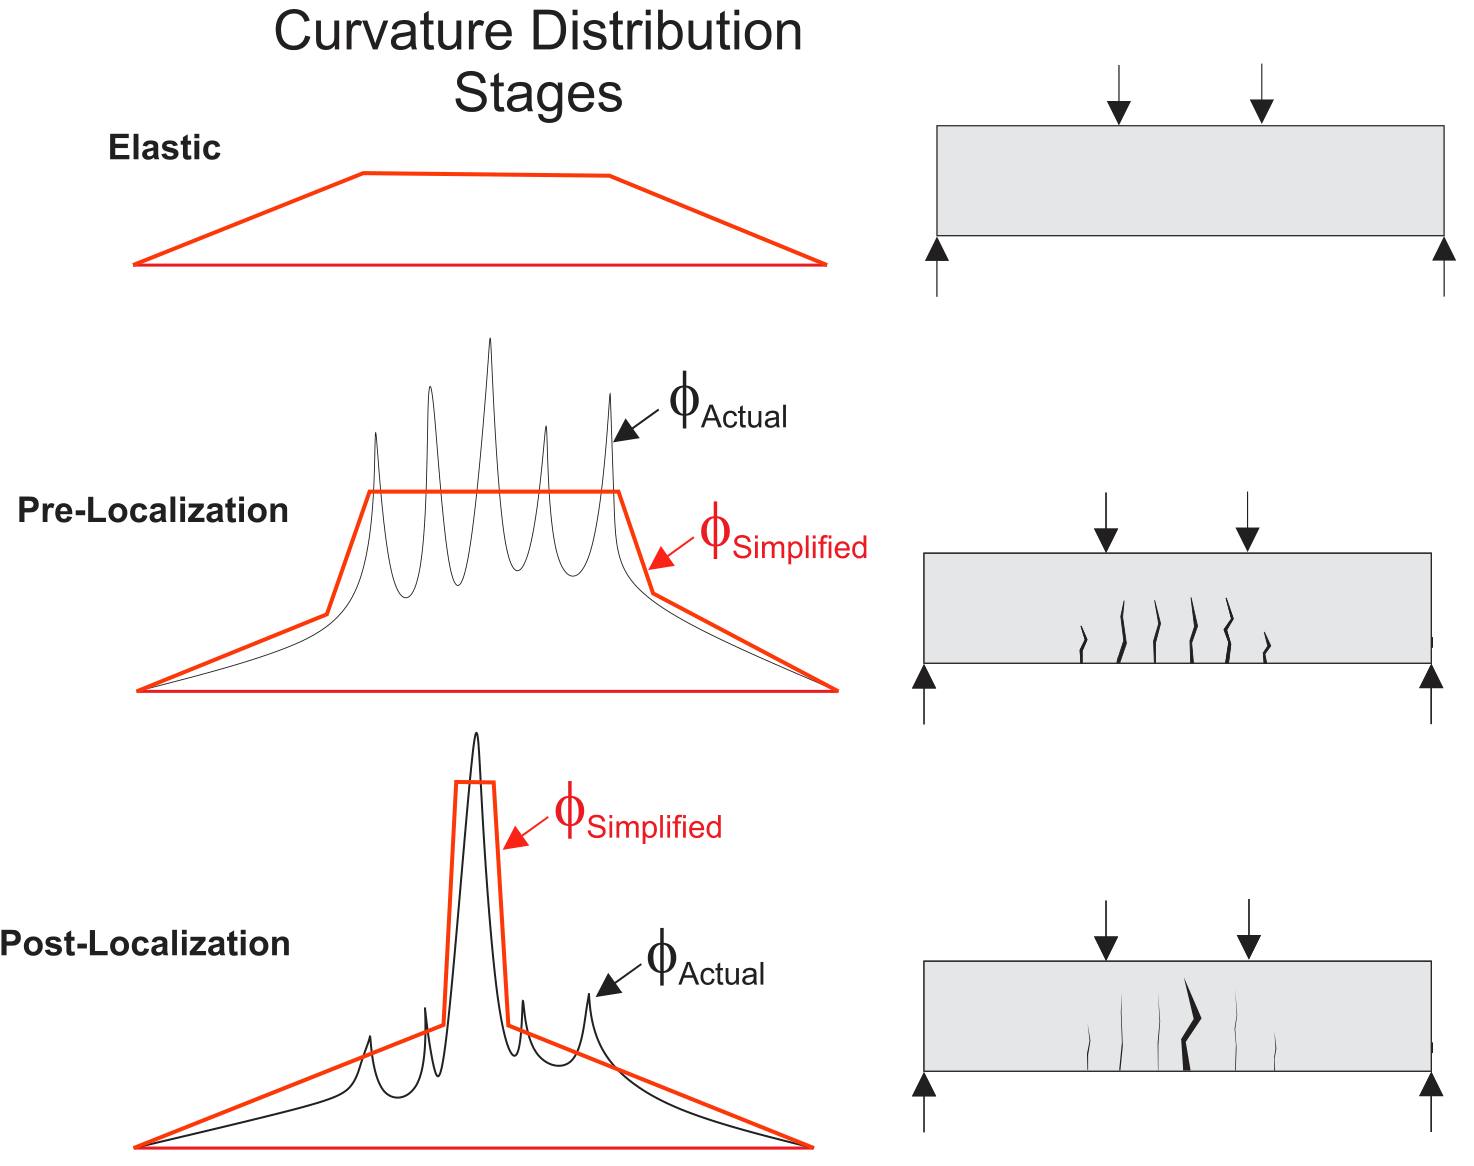
Before the peak the curvature follows the moment diagram, so the integral is taken over the trapezoidal (4-point) or triangular (3-point) distribution. This is the homogenized range, where cracks are distributed along the loaded zone.
Localization and the plastic length
Once the tension law softens, the moment drops, the cracks outside one zone close elastically, and the curvature concentrates in a single hinge. The software models this with a plastic length \(L_p\): the post-peak curvature acts over \(L_p\), and the rest of the beam unloads along its elastic branch. The plastic length is an input on the Geometry tab. The suggested values are the constant-moment zone \(S_2\) in 4-point bending, the section depth \(h\) in 3-point bending and 25 mm for the EN 14651 notched prism.
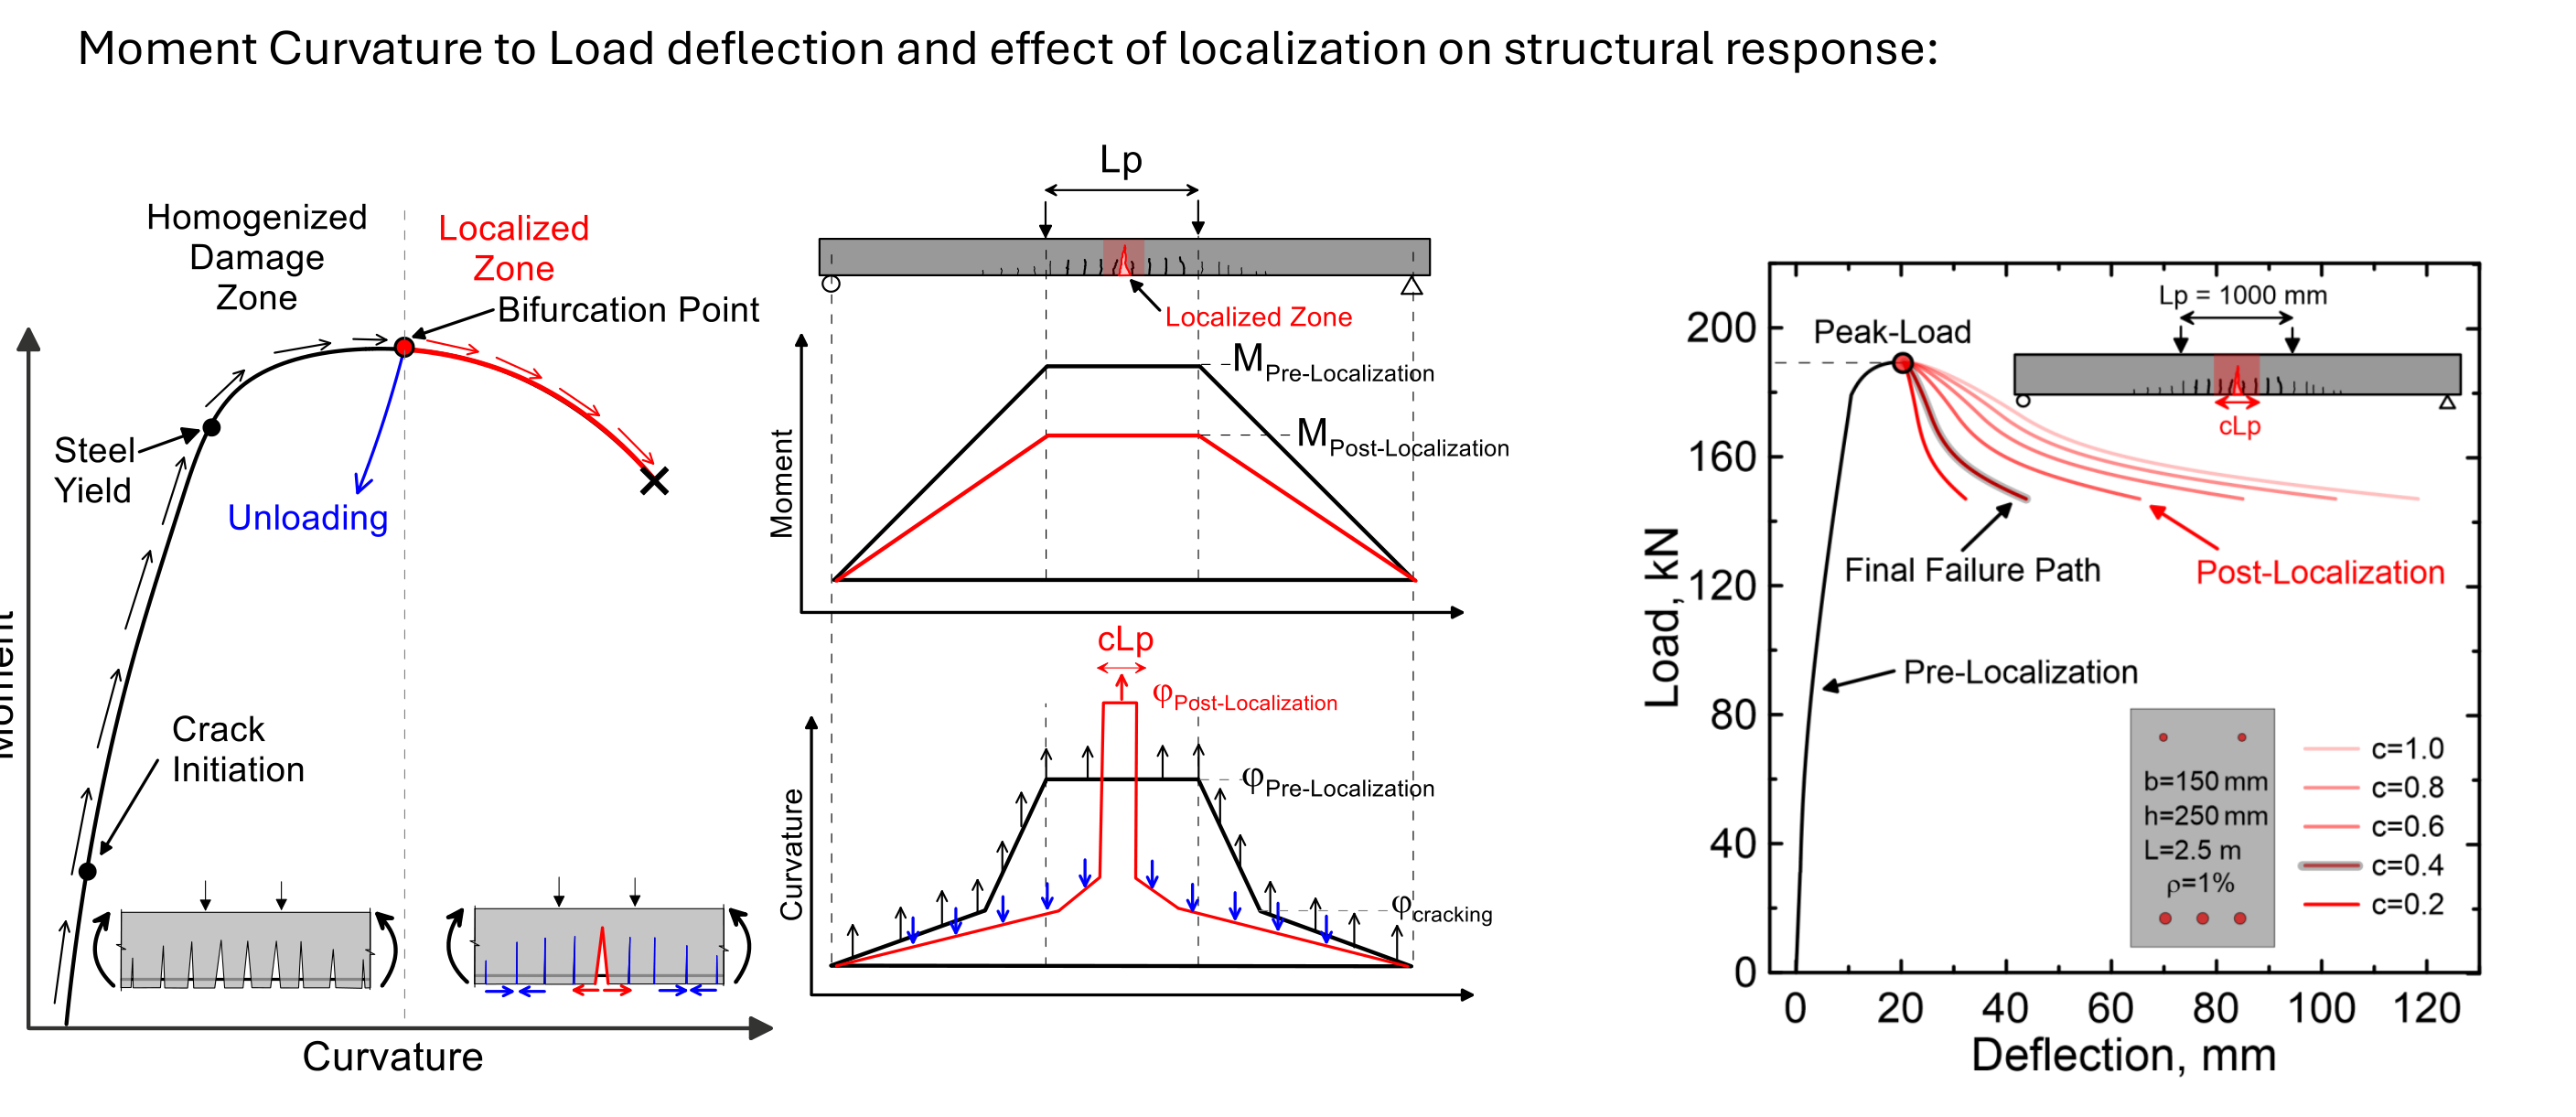
For a beam with rebar the peak is governed by the maximum total tension force, fibers plus steel, rather than by any single stress coordinate. The Force Profile tab of the design modules shows this share.
Notched beam, crack width
Version note. The kinematics below are the model itself and do not change. Using them to transform each trial model forward onto the measured CMOD, instead of converting the imported record, belongs to the EN 14651 change listed under Unreleased in the release notes. Earlier builds use the import-conversion workflow.
In the EN 14651 module the single crack is prescribed by the notch. The section response is written as moment against the rotation of the hinge of length \(L_p\), and the crack opening at the notch tip follows from the rotation and the distance from the neutral axis,
Below the notch tip there is no ligament, so the two halves separate rigidly and the opening at the gauge line, a distance \(d_n\) lower, is
That relation is evaluated for every trial law during the inverse analysis, so the measured CMOD record is never converted: the model is transformed forward onto the measured coordinate instead. The residual strengths reported on the Flexural Stress-Crack Width tab use the EN 14651 definition on the simulated curve:
at the four CMOD values 0.5, 1.5, 2.5 and 3.5 mm, and \(f_{LOP}\) from the largest load in the CMOD window 0 to 0.05 mm. The ligament depth \(h_{sp}\) is the Height entered in the module; the notch depth is added below it.